Introduction to LiveDebugger: A Tool for Debugging Phoenix LiveView Apps
 kraleppa•Mar 26, 2025•5 min read
With the recent launch of Phoenix LiveView 1.0.0, the library has become more popular and is now considered as a compelling option for developers creating web applications. In response to the growing demand and the unique debugging challenges presented by this technology, we developed LiveDebugger.
What is LiveDebugger?
LiveDebugger is a specialized tool designed to enhance and simplify the debugging process for Phoenix LiveView environments. It provides developers with a much clearer overview of their applications by allowing them to inspect the states of LiveViews or LiveComponents easily and monitor the transitions of those states. Think of it as a React DevTools equivalent suited for LiveView — a reliable partner that simplifies everyday debugging tasks.
The need for LiveDebugger
The idea for LiveDebugger came up when we were working on a complex web application for a client using Phoenix LiveView. The project involved many LiveComponents that interacted with each other, and keeping track of all these moving parts was tough. For developers, understanding each component’s state and how they interact with each other is crucial, especially when it comes to fixing bugs.
Typically, to troubleshoot issues, we would rely on logging or using standard Elixir debugging tools like dbg/2 to trace what's happening in the application. However, these methods weren't very helpful in our case because as the application grew, so did the number of log entries. Imagine trying to find useful information from thousands of logs that come not only from the application but also from external sources like databases. It's like looking for a needle in a haystack.
That’s why we came up with LiveDebugger. This tool is specifically designed for debugging Phoenix LiveView applications by allowing developers to see how LiveViews and LiveComponents interact and change. With LiveDebugger, you don’t have to browse through tons of logs. Instead, you can directly observe your application’s behavior easily and interactively, making it simpler to understand and fix issues.
Key features
There are several features provided by LiveDebugger that help with navigation through the LiveView application environment.
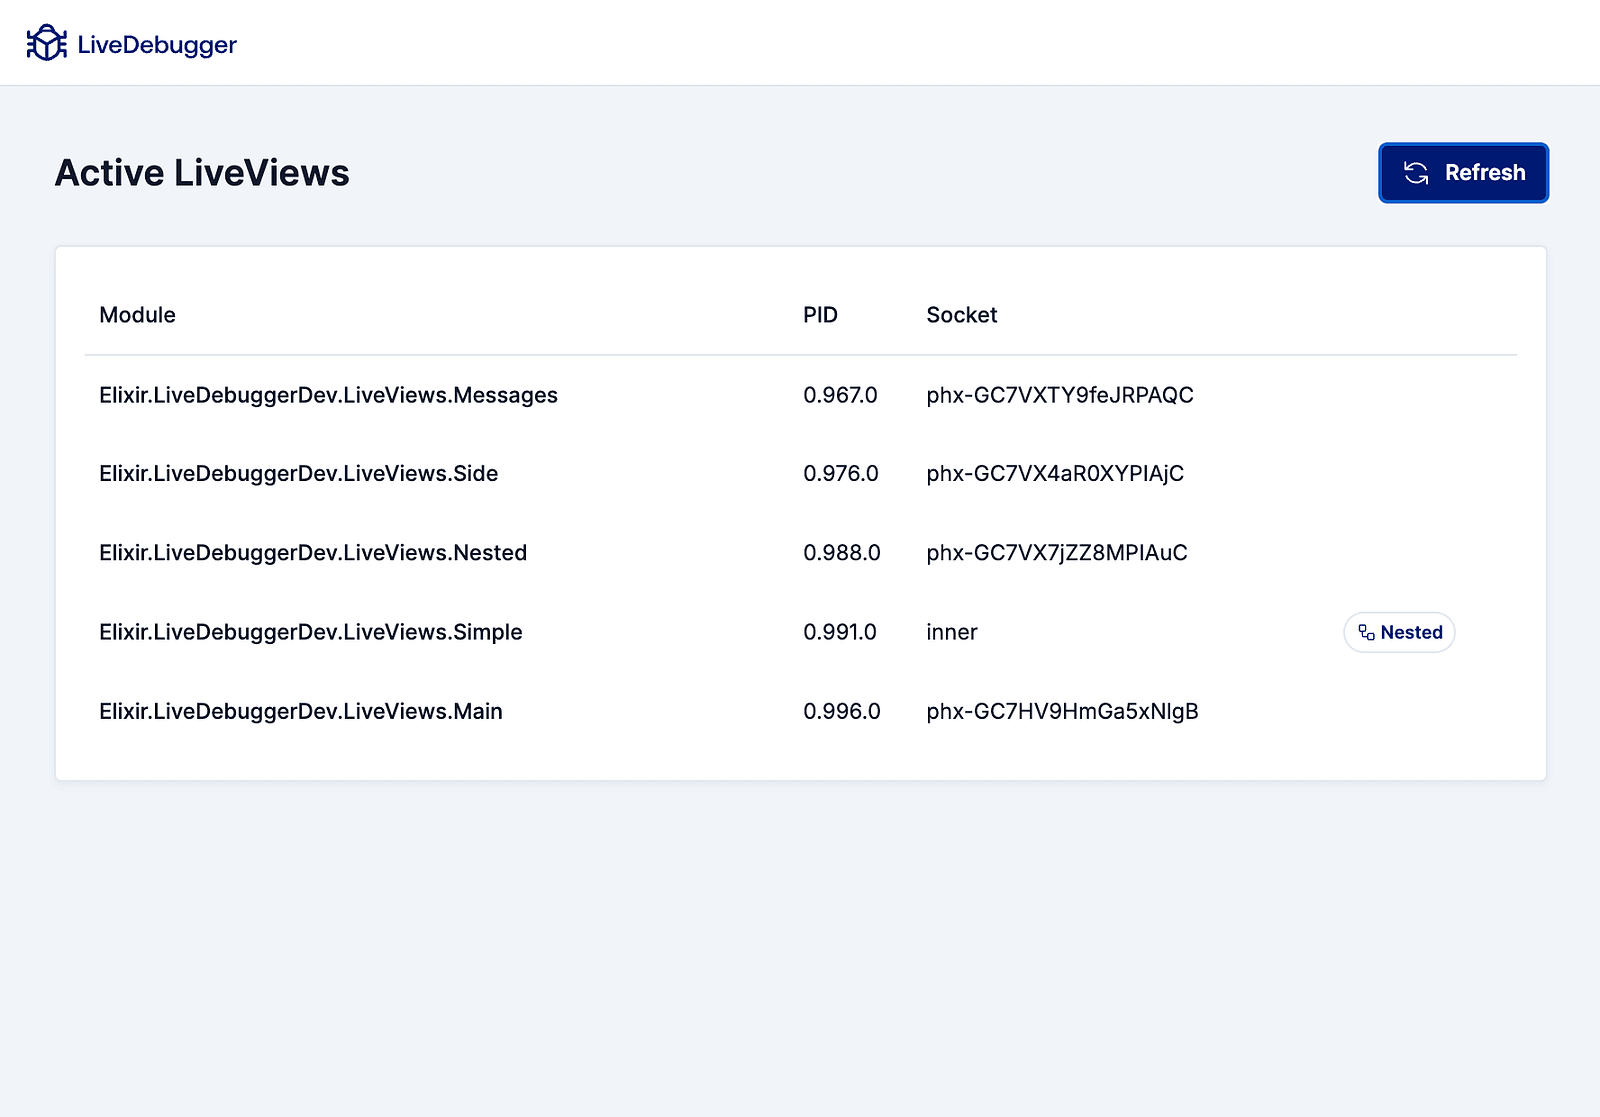
🖥️ Active LiveViews dashboard
LiveDebugger introduces the Active LiveViews Dashboard, a feature that helps you keep track of all the active LiveViews in your application. This tool can be used when you’re dealing with multiple LiveSessions in different browser windows or managing nested LiveViews.
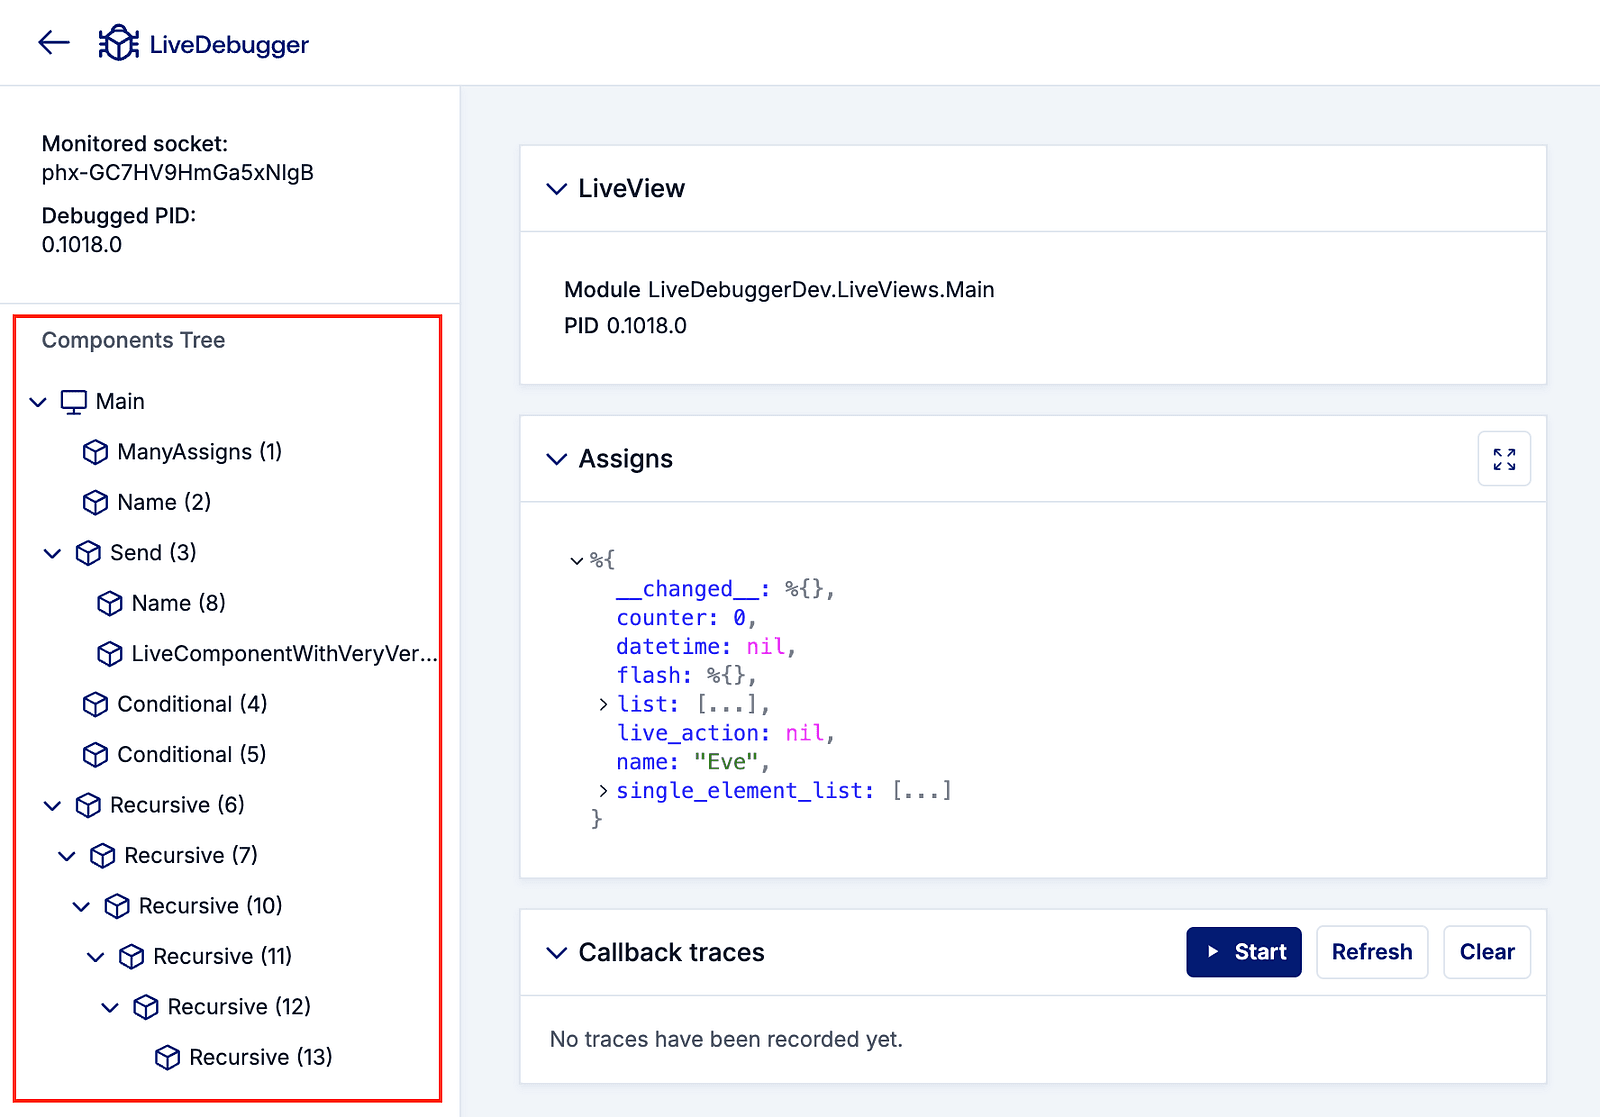
🌳 Components tree
Understanding how your LiveComponents are structured can be a complex task, especially in large applications. LiveDebugger simplifies this by providing a detailed view of the entire LiveComponents tree. This visual representation helps you see the hierarchy between components, making it easier to navigate and manage your application’s structure.
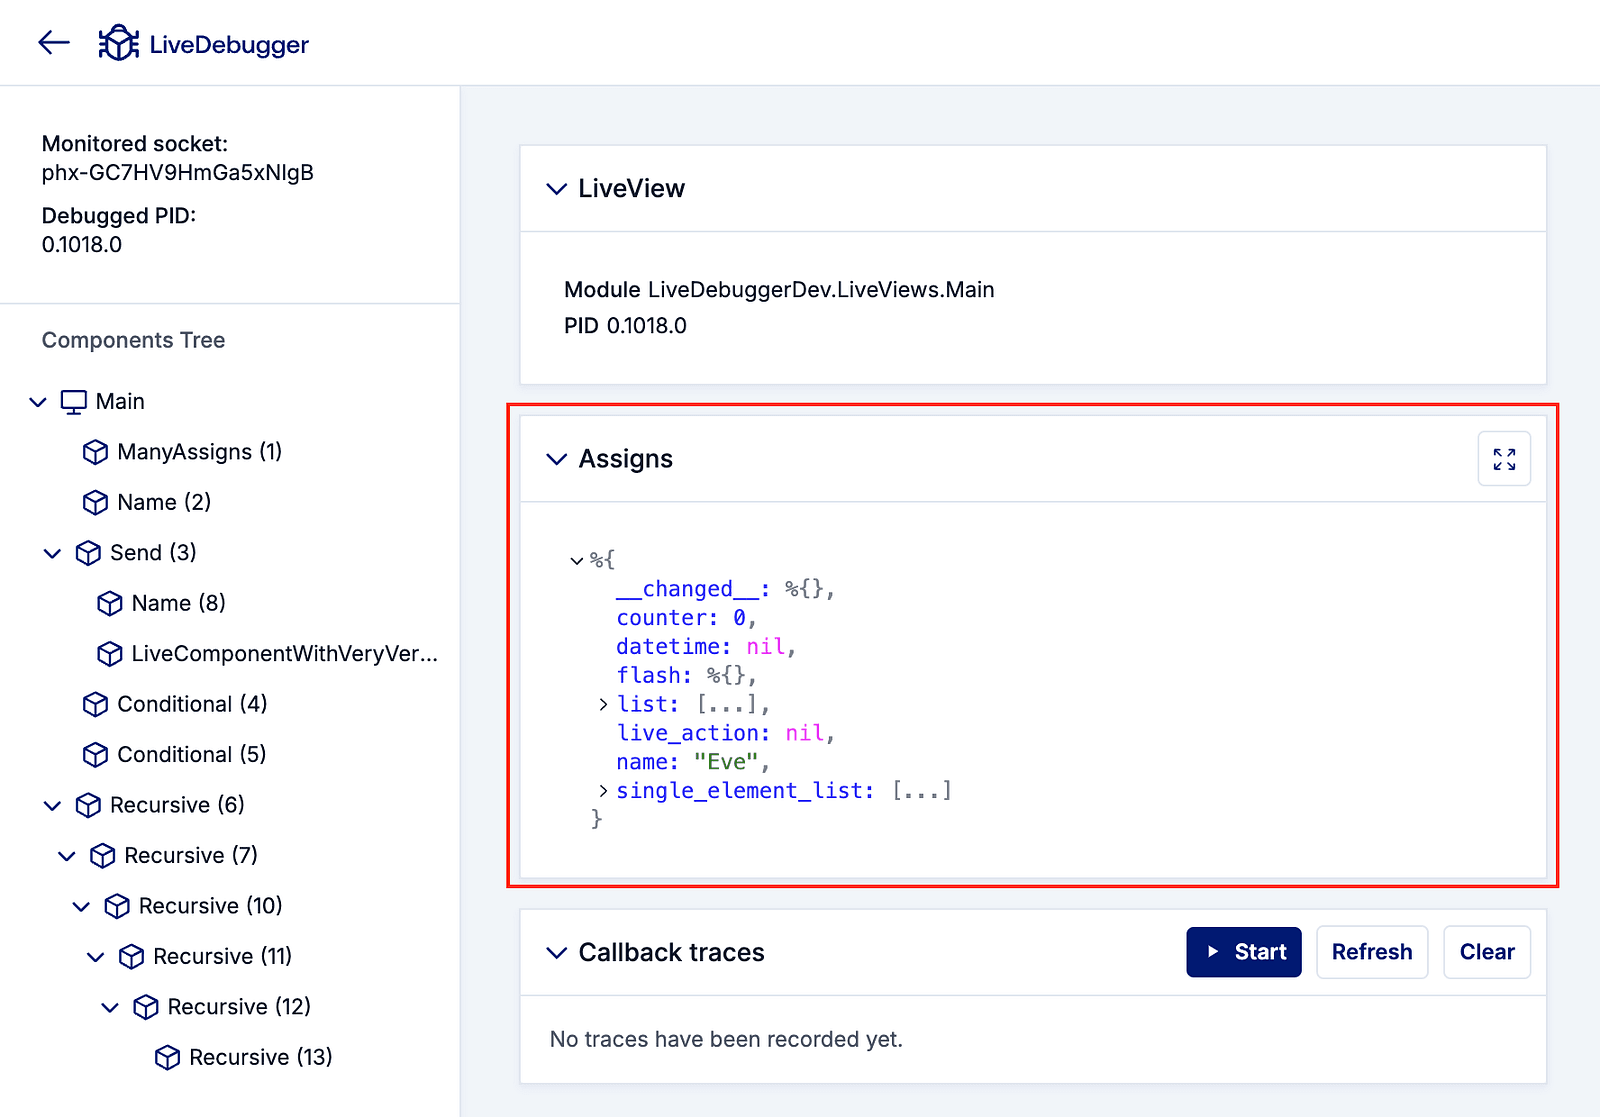
🔍 Assigns inspection
LiveDebugger allows you to inspect the current state of assigns in both LiveViews and LiveComponents, which are crucial as they hold the state and data needed for rendering your components. Being able to quickly view and analyze these assigns helps you understand what data is being passed around and how it affects the rendering and behavior of your views and components.
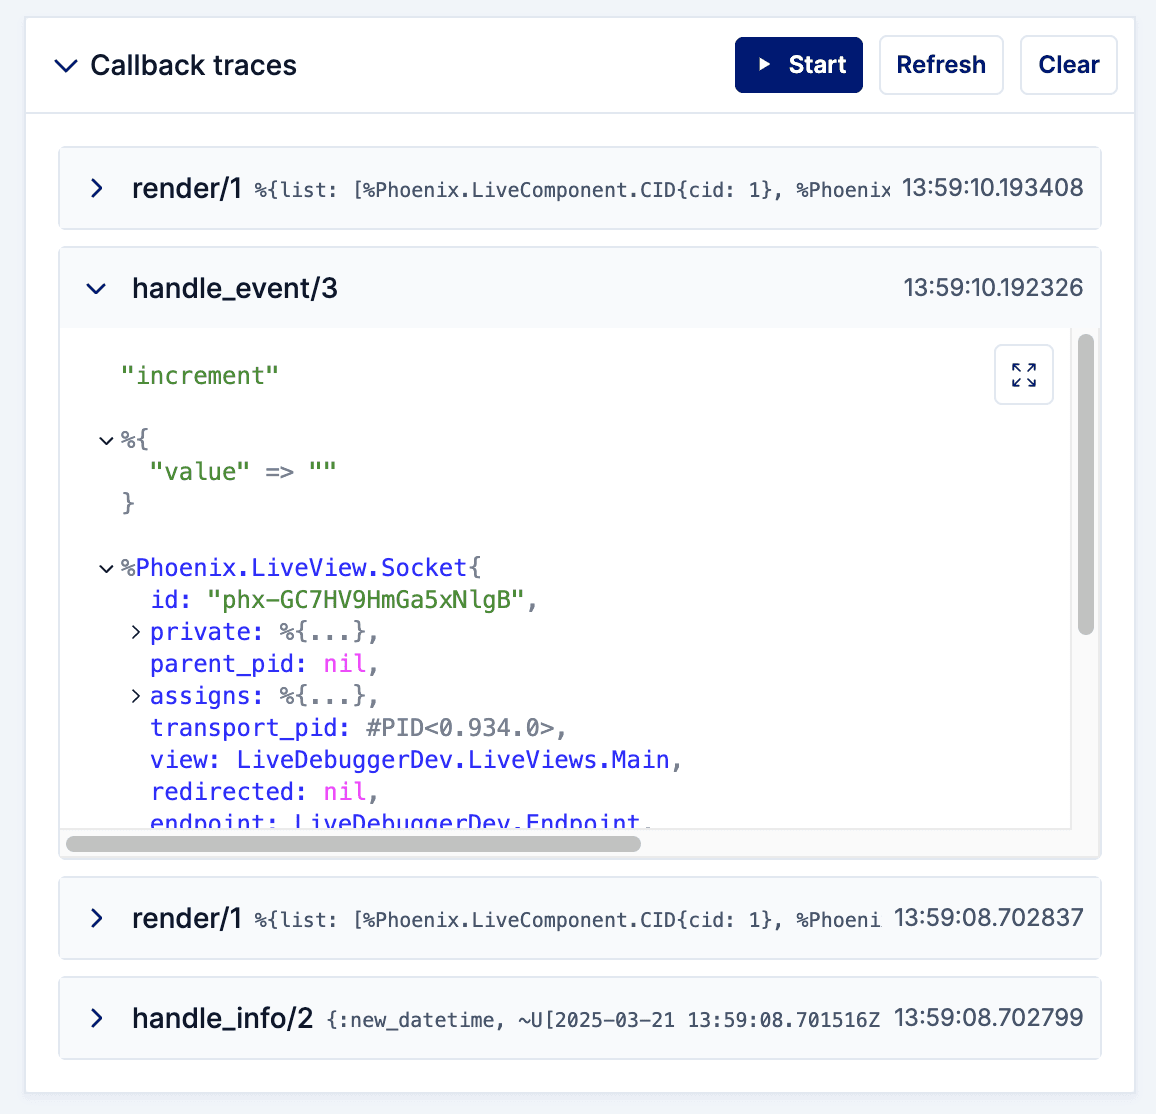
🔗 Tracing callback executions
Finally, LiveDebugger has the ability to trace the execution of callbacks within your LiveViews and LiveComponents. This means you can see not only which callbacks are being triggered and in what order, but also inspect its arguments, providing insight into the flow and execution of your application logic. This feature is particularly valuable when you need to diagnose issues related to event handling or lifecycle events, ensuring you can pinpoint and resolve problems faster.
Future plans for LiveDebugger
As LiveDebugger continues to evolve, our team is committed to enhancing its capabilities and usability to better serve developers working on Phoenix LiveView applications. Looking ahead, we have exciting updates and new features in the pipeline, designed to make LiveDebugger even more powerful and intuitive.
Scheduled updates
We are on track to release version 0.2.0 of LiveDebugger at the beginning of May. This update will include significant improvements and new functionalities that expand its debugging capabilities:
- Chrome DevTools extension: Integrating LiveDebugger directly into your browser, this extension will allow developers to use LiveDebugger within Chrome DevTools. Extension will be optional, and it’ll still require adding a LiveDebugger dependency to the debugged project.
- Components highlighting: This feature will enable developers to visually highlight LiveComponents on their web pages.
- Dark mode: Recognizing the wide adoption of dark themes for development environments LiveDebugger will introduce a dark mode.
- Filtering of callback traces: To enhance the callback tracing capabilities, filtering options will be added to allow developers to focus on the most relevant callbacks.
- Enhanced support for nested LiveViews: Currently, support for nested LiveViews is quite limited — we’re planning to expand it significantly.
Further development
The continual development of LiveDebugger is guided by the needs and feedback of the Phoenix LiveView developers community. We are committed to not only expanding its feature set but also refining existing ones to provide a seamlessly efficient debugging experience.
These planned updates and new features are just the beginning. We believe that with these enhancements, LiveDebugger will further solidify its position as an important tool for Phoenix LiveView developers.
Check our GitHub, where you can find installation instructions, and follow us on our social media. If you found any bugs or had an idea for a feature feel welcome to report it as an issue via our form.
Stay tuned for more updates on LiveDebugger!
We’re Software Mansion: multimedia experts, AI explorers, React Native core contributors, community builders, and software development consultants. Hire us: [email protected].