React Native Debugging: New Performance Panel in React Native 0.83
 Mariusz Stanisz•Dec 15, 2025•6 min read
In recent years, React Native debugging has become much easier thanks to a wave of new developer tools. One of them is Radon that enables true live debugging. Now, the React Native team has brought their own powerful improvements to the toolbox.
Since React Native 0.76, we can use React DevTools with its UI based on Chrome DevTools. Until now, DevTools have been used primarily for viewing logs (Console), inspecting memory usage (Memory), exploring the component tree (Components), and — most importantly — using the React Profiler to track component re-renders across the application. With React Native 0.83, there is a new feature coming: the Performance panel.
What is the Performance panel?
If you’re familiar with web development, you’ve probably encountered the Performance panel, which offers a wealth of insights for tracking application performance bottlenecks. It covers everything from CPU and network throttling, through web vitals measurements, to performance trace recordings. That last feature is the most powerful one and becomes part of React Native DevTools in React Native 0.83. It’s designed to help developers measure, visualize, and understand the runtime performance of their applications.
Note: The Performance tab is already available in previous versions of React Native, and you can turn it on in Settings > Experiments > [React Native] Enable Performance panel. However, it doesn’t have all the features coming in React Native 0.83.
If you want to get the trace for profiling, you just need to press the Record button, and start interacting with the app. After you’ve done all necessary steps, you need to stop the recording and start debugging!
The trace recorded via the Performance tab includes the following information:
- Scheduler tracks — shows the React Scheduler activity
- Components — components execution time as flamegraph
- Thread — JS functions flamegraph
Now, let’s focus on each of the sections individually to understand what they offer.
Scheduler tracks
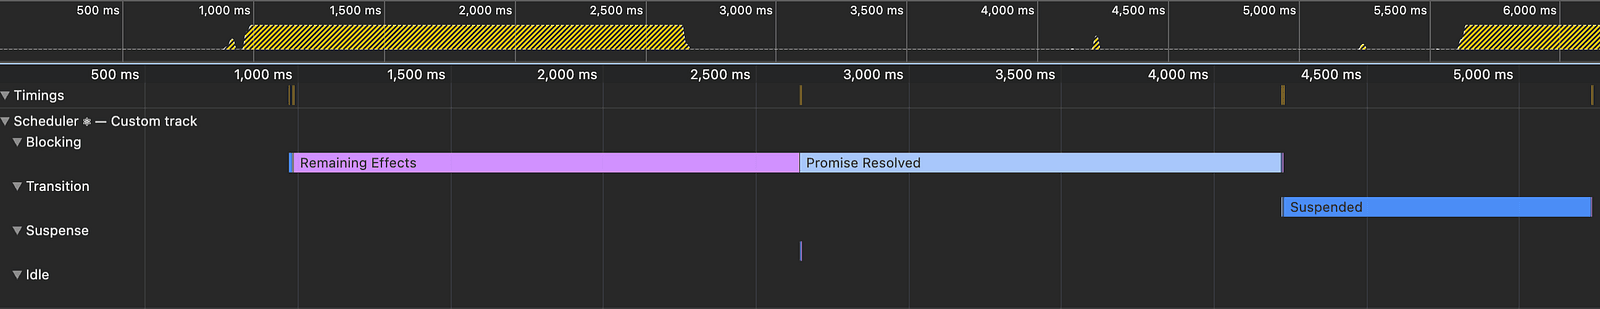
React Scheduler manages the timing and prioritization of UI updates to keep the application responsive. Since React 19 and the beginning of concurrent rendering era, it becomes vital to understand how React behaves to track performance bottlenecks. In the Performance panel the Scheduler is divided into four tracks:
- Blocking — high priority updates that block the UI
- Transition — work related to
useTransitionhook and deprioritization of some state updates - Suspense — work related to the
React.Suspensecomponent - Idle — lowest priority, executes only if there’s no other work scheduled, used by
Activity
In each of the tracks, we can follow the exact React activity. Usually UI updates are divided into five phases:
- Update — indicates the time spent on calculation of what caused the render
- Render — time spent by calling the render functions of the components and on the reconciliation, so comparing the Virtual and actual DOM tree to determine what needs to update on the UI
- Commit — the actual DOM tree update with layout effects (layout effects execute before the paint, but they are included into the commit phase)
- Waiting for paint — React has done all its work, after this phase the UI change has been painted (unless it’s Waiting which indicates, that the paint will happen after the Remaining Effects)
- Remaining Effects — execution of all the effects caused by the render
It’s important to understand when the UI paint happens. As you can see it may happen in two different moments of the update, which may cause confusion. In case of re-renders caused by user interaction (such as a button press) the UI paint will happen after the execution of remaining effects. It means that if the re-render triggers a long running useEffect, the user won’t see a UI update until the effect finishes. If a re-render was not caused by user interaction (but eg. by setTimeout) the UI paint will happen after the commit.
In the scheduler tracks, we may also see other tasks that have been executed, e.g.:
- Promise Resolved — UI-blocking promise resolution
- Cascading updates — when React needs to pause a UI update because a newer update has begun in the meantime
- Suspended — when React decided to postpone the render marked by the
useTransitionhook
Components
In the components section you can see a flamegraph with the execution time functions related to the updated component and its children. Depending on the color, they’re related to different phases:
- blue — render function time
- purple/red — remaining effects time (it shows only effects that have duration of 0.05 ms or longer, or triggered an update)
- yellow — events related to mounting and unmounting the subtree
At this point, you might wonder how to use it if you already have the Profiler. You can treat it as a source of additional information that will allow you to link specific components in relation to React activity and JavaScript execution timeline. It’s all displayed all together so you can debug it a bit deeper.
Thread
In the Thread section you can track the JS activity and see exact time of the function execution in your program. This is a fantastic tool to track problems inside JavaScript code. Thanks to it, you can easily find functions that are defined in your code and see how much time they really take.
By default most of the functions invoked by React internals are going to be hidden leaving you with the most important information. However, if you need more detailed data, you can always turn the ignore list off by going to Settings > Ignore list > Enable ignore list.
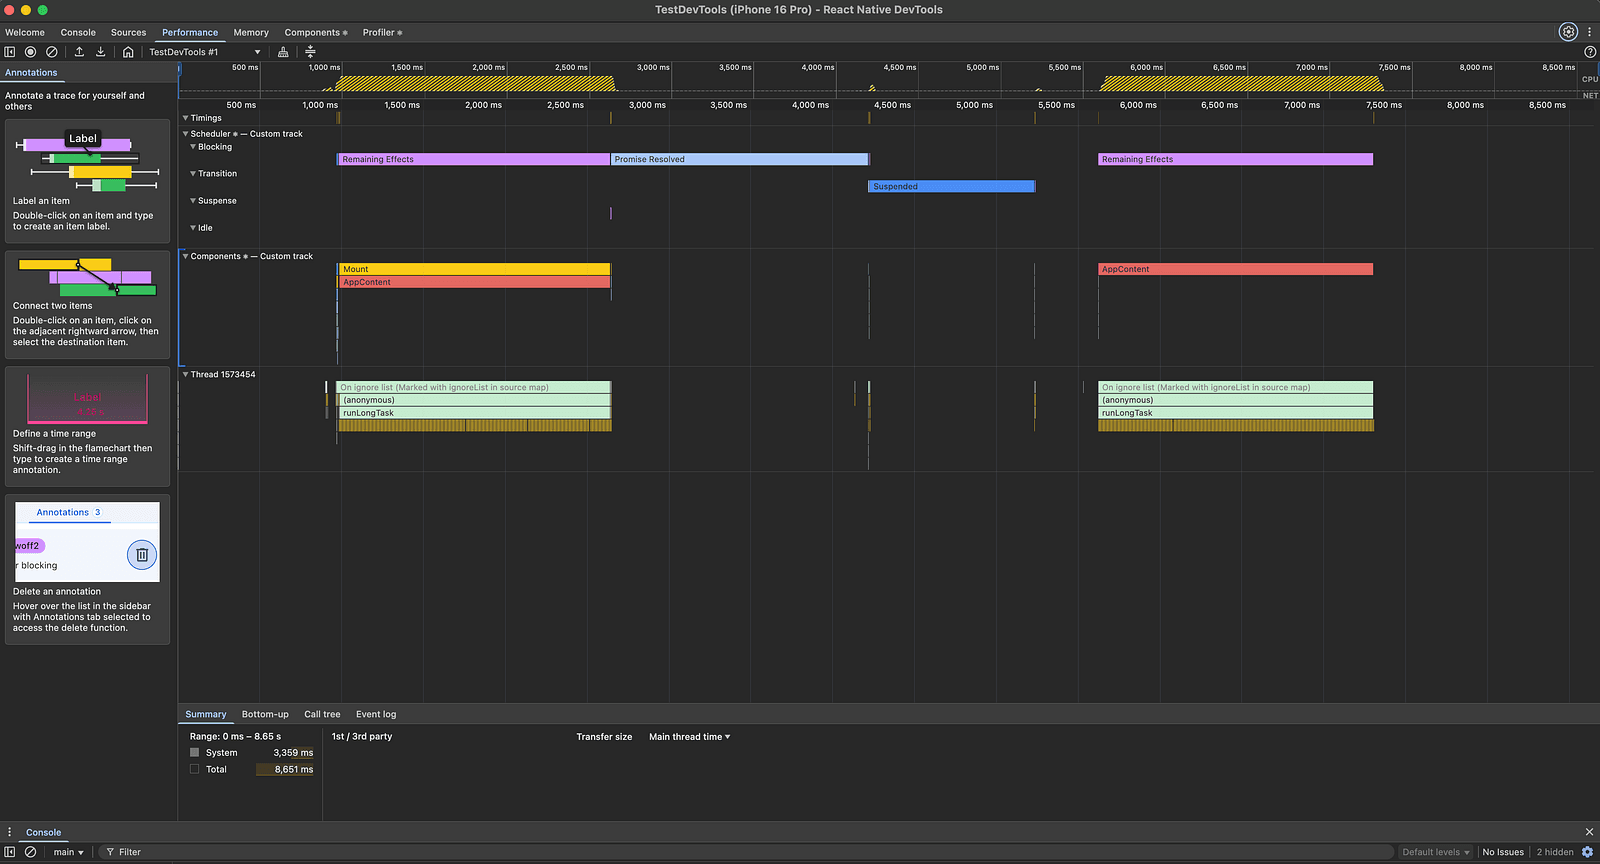
Labels and annotations
If debugging takes long or you want to share the trace with another dev, you may need to start taking notes. Thanks to the Performance tab it is easy to add labels and annotations to specific functions.
In order to add a label you need to double-click a specific item and start typing. You can see all your annotations listed on the side panel. Apart from that you can connect two items via an arrow to see better some links between functions. After the double click there will be an arrow that you can drag to an item of your choice:
The takeaway
With the new Performance tab in React DevTools, debugging and optimizing React Native apps just got a lot easier.
By exploring the Scheduler tracks, you can understand how React prioritizes and executes updates, the Components view helps pinpoint costly renders and effects, and the Thread view exposes heavy JavaScript functions. Together — with annotations and labels — the Performance tab becomes a full-fledged investigative tool for understanding how your app behaves under the hood.
As React Native keeps evolving, these capabilities make it easier than ever to spot bottlenecks, boost responsiveness, and improve user experiences. If you haven’t explored the Performance tab yet, now is the perfect time to start!
We are Software Mansion — software development consultants, a team of React Native core contributors, multimedia and AI experts. Drop us a line at projects@swmansion.com and let’s find out how we can help you with your project.