Best React Native Debugging Tools in 2025
 Kacper Kapuściak•Jan 7, 2026•7 min read
Best React Native Debugging Tools in 2026

Let me share something I’ve learned about coding over the years. Sometimes it’s not only about the skill but also about the tools that we use. Just as it’s easier to run in good running shoes, it’s easier to work on your app when you have good React Native debugging tools at your disposal.
According to the State of React Native 2024 survey, using console.logs is the most popular method for debugging React Native applications.
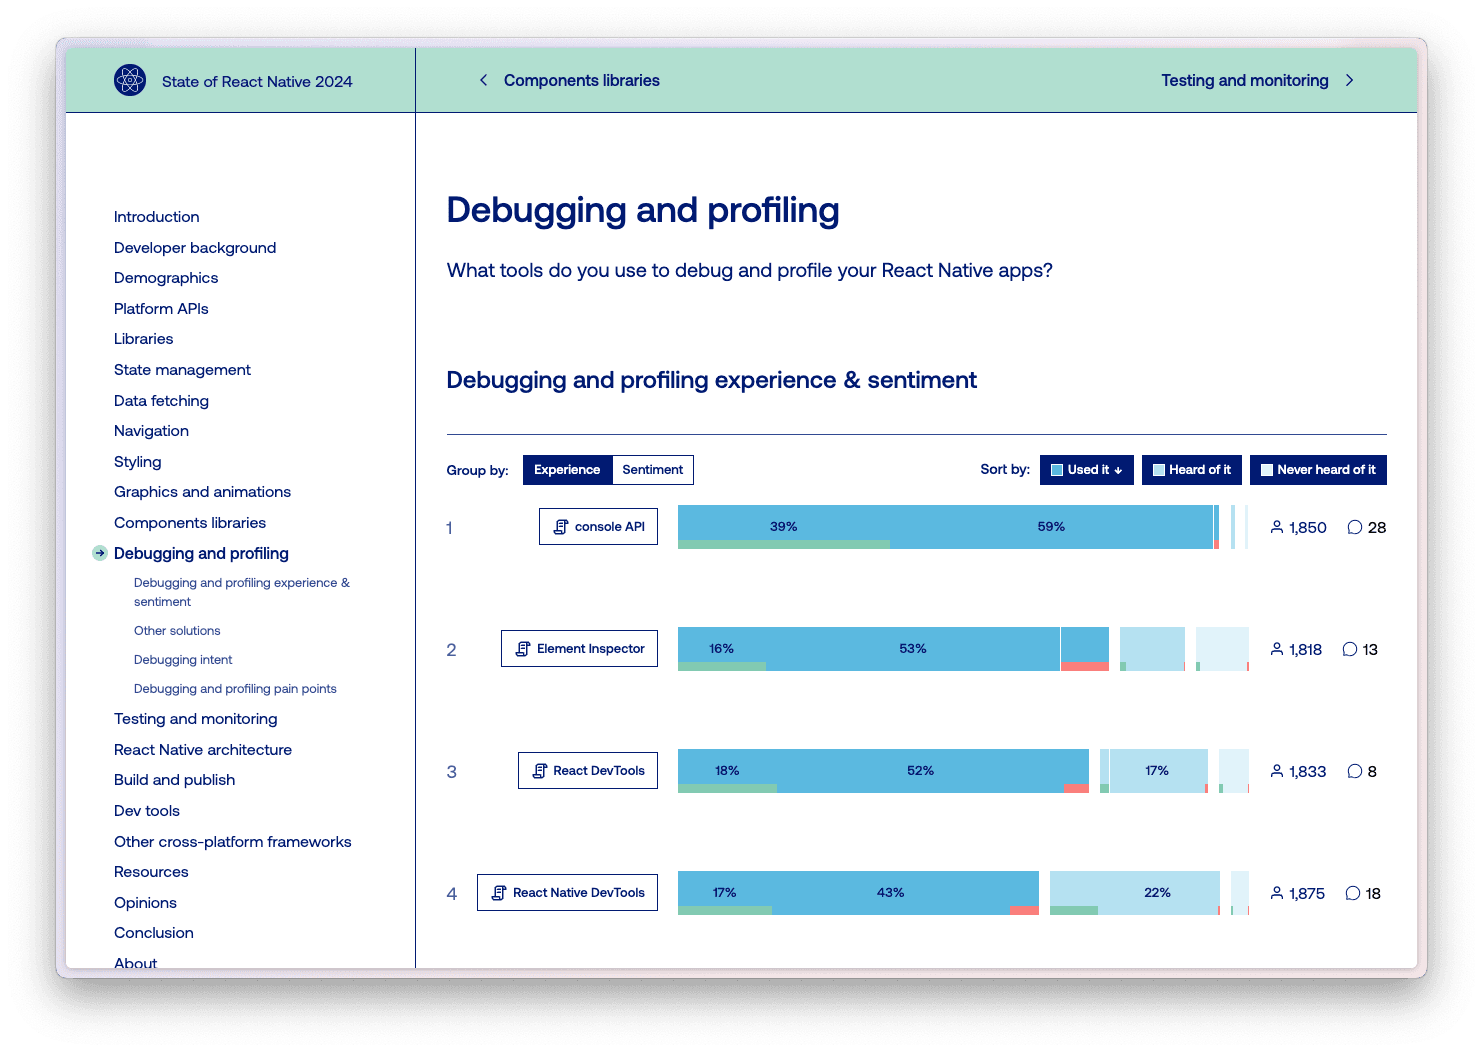
This is not all that surprising, as the good ol’ console log is the first thing we learn when we start programming. And, in many cases, logging stuff to the console just gets the job done. But the React Native console leaves a lot to be desired as it lacks some useful functions, like console.table(), which is very handy for debugging JavaScript objects.
There’s got to be a better way, right?
4 React Native debugging tools you should use
React Native DevTools
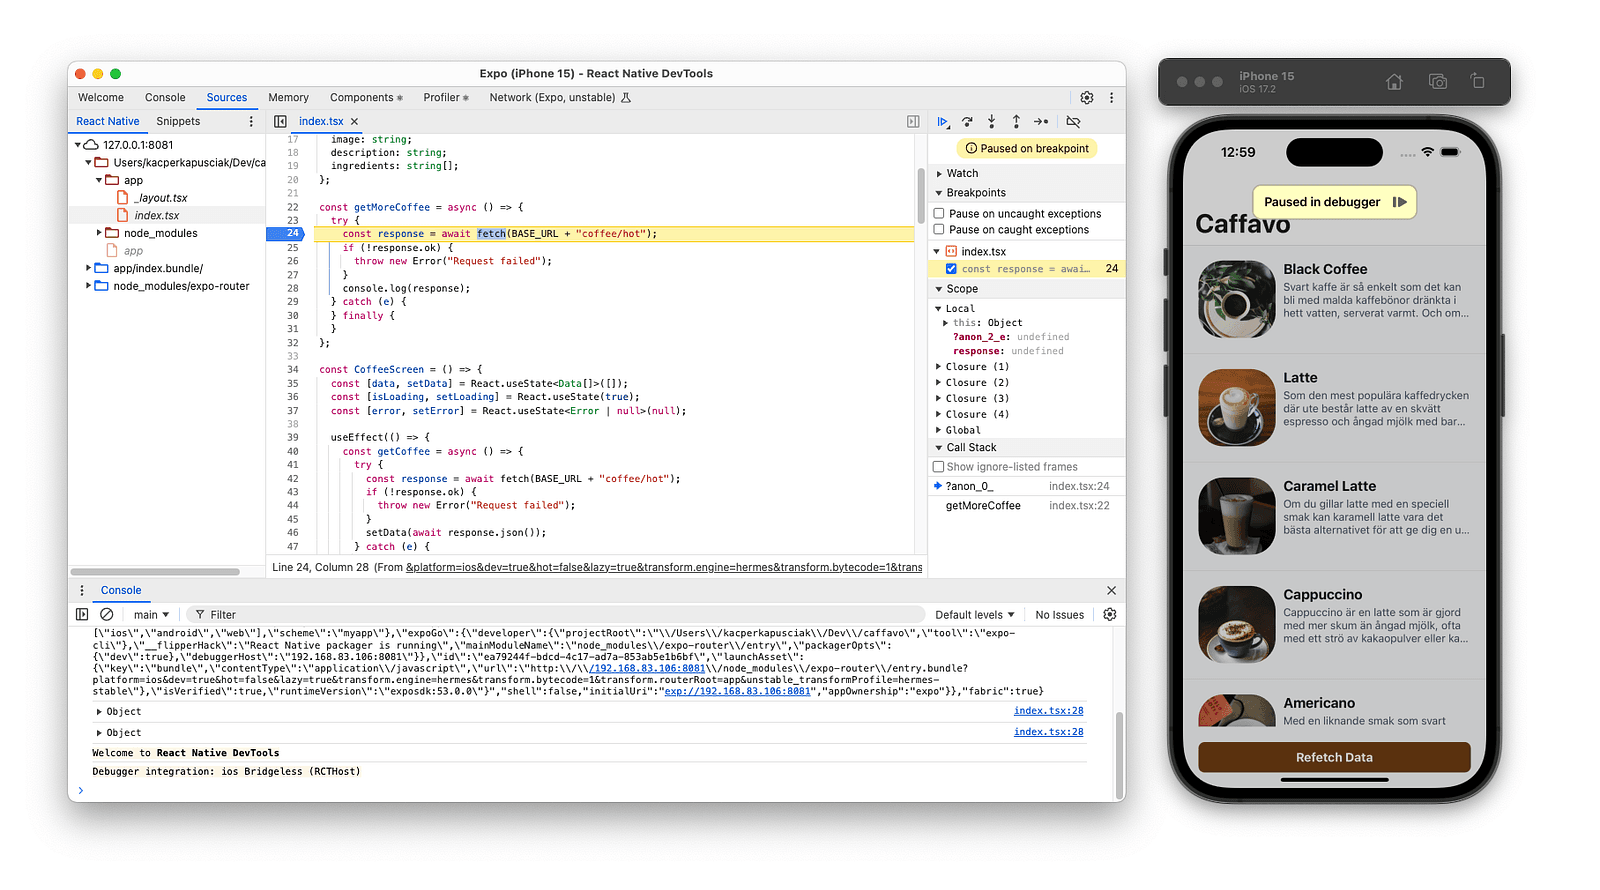
Announced at React Universe Conf 2024, React Native DevTools was referred to as the “new React Native debugger” to replace Flipper and other legacy debuggers. Starting with React Native 0.76, it has become the default debugging tool for React Native developers and is recommended by the members of the React Native core team. For those coming from a web background it feels like home, as it uses the same frontend layer as Chrome DevTools.
You can launch React Native DevTools directly from the application by selecting Open DevTools in the Dev Menu or from the CLI by pressing “j” on the keyboard.
It’s packed with essential features, like a console for inspecting logs from your application and breakpoints that allows you to pause code execution by clicking a line number in the Sources tab or by placing a debugger statement in your code. In addition, it pauses the application when a crash occurs, allowing you to inspect the stack trace.
Even though JavaScript is a garbage-collected language, it’s still possible to have memory leaks, so it’s good to know how to find them. Thanks to the Memory panel, you can take a snapshot of the JavaScript memory heap or use allocation sampling to observe how much memory is being used while the application is running.
The React DevTools provide an interactive live view of the React component tree, and the Profiler tab shows the speed of loading and updating components by analyzing the rendering time and duration of the React’s commit phase.
Although there is a built-in network inspector, it requires the expo package to be installed in the project, and quite frankly I couldn’t get it to work at all in my setup. (Well, it’s marked as unstable for a reason).
The following features work great, but while React Native DevTools is a significant improvement over legacy solutions, it doesn’t cover all of Flipper’s functionalities. Also, having a separate window where you code and a separate one where you debug isn’t the most convenient.
Reactotron
Reactotron is a free and open-source desktop application by Infinite Red designed for inspecting React and React Native applications.
At its core, Reactotron offers a suite of debugging plugins for inspecting the application’s internal state. It integrates with state management libraries, like Redux or Mobx-State-Tree, to allow you to track your app’s state changes as they happen. Beyond state management, you can also inspect the contents of local storage solutions like AsyncStorage and MMKV, allowing you to see what data is being stored on the device.
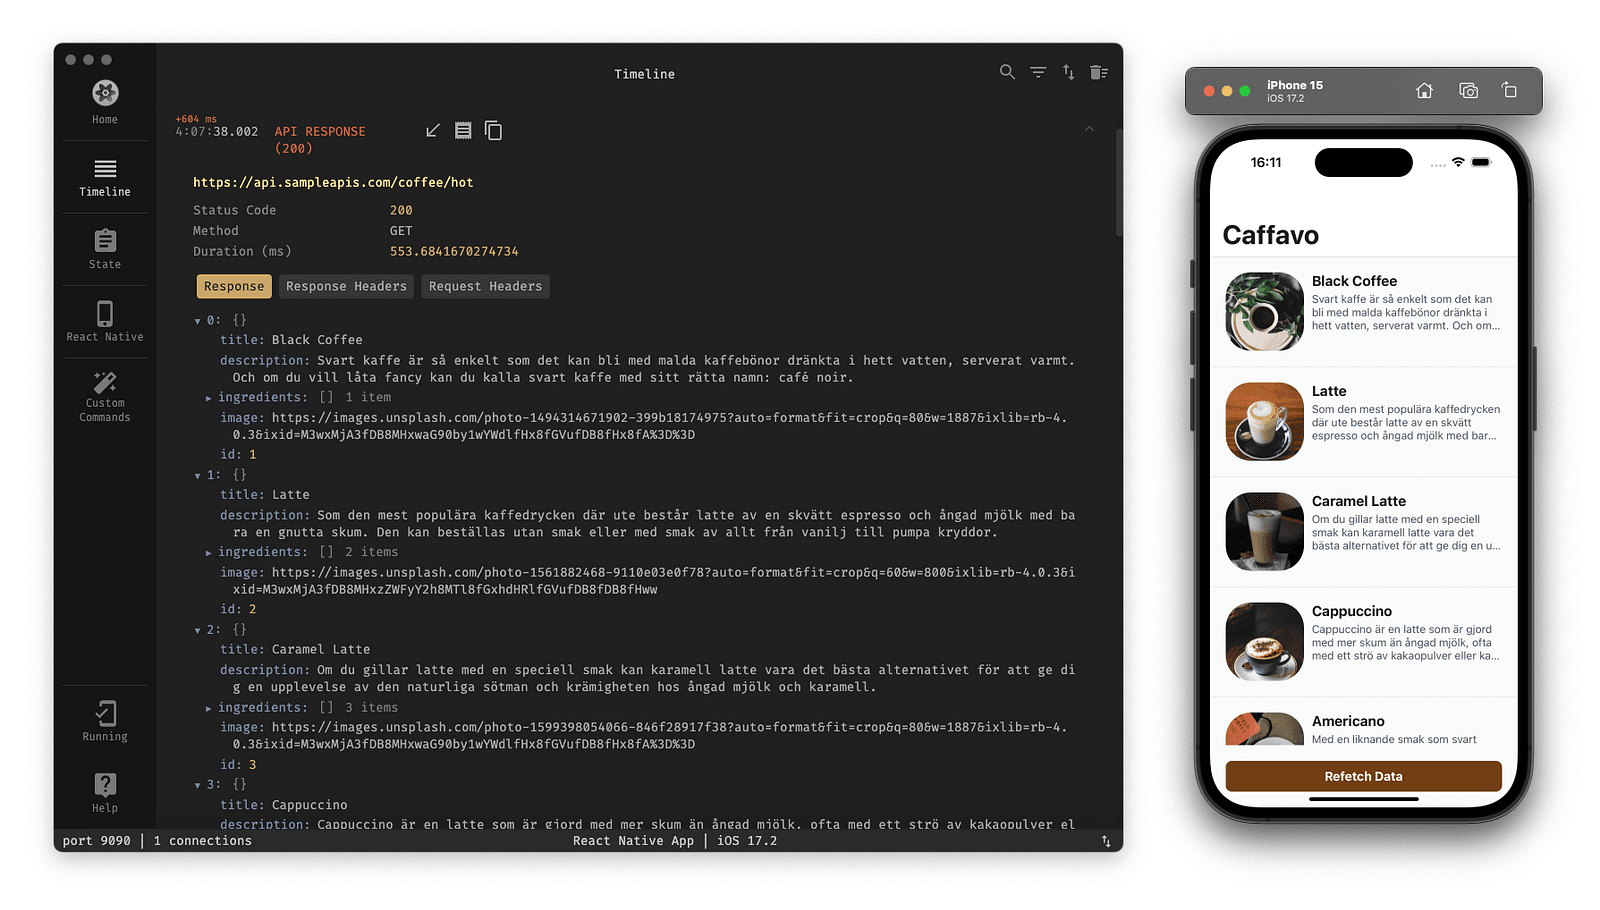
The networking panel in Reactotron allows you to inspect the XMLHttpRequests and fetch requests in your application specifically by examining the request duration, request body, status code and headers.
On the negative side Reactotron isn’t a complete plug-and-play React Native debugging tool as it requires adding a separate dependency and a snippet of code to your application which I’m not very fond of doing.
Radon IDE
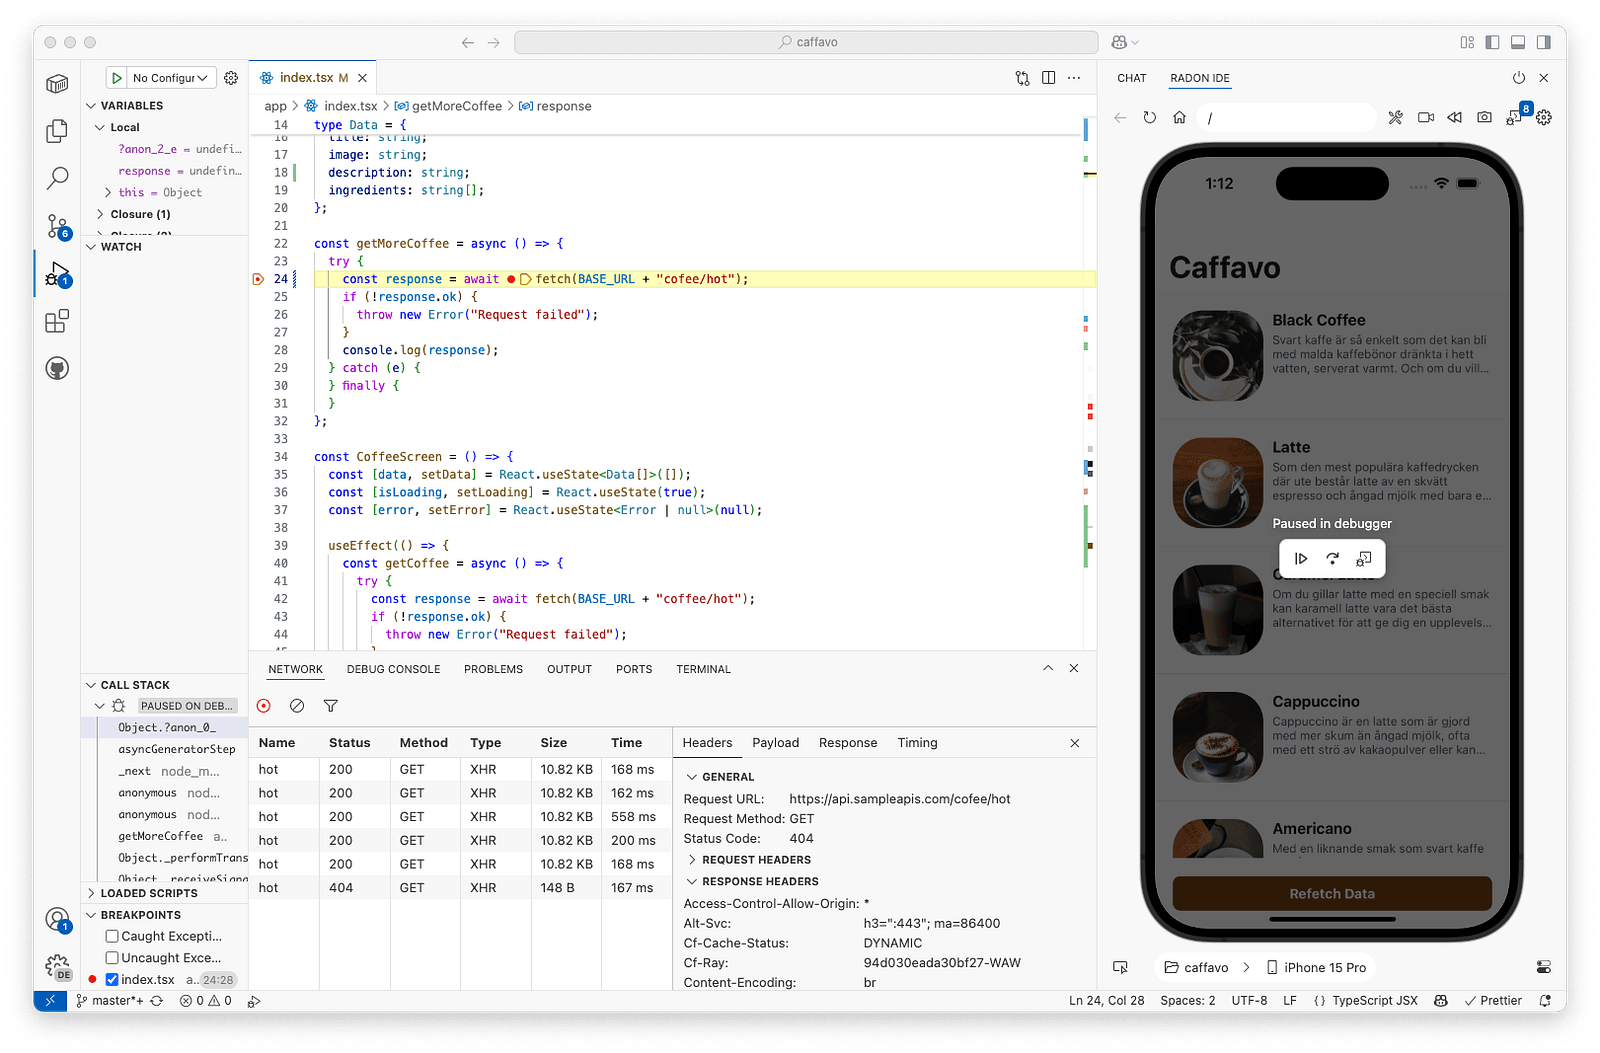
Radon IDE is a VSCode and Cursor extension that turns your editor into a fully featured IDE and debugging tool for React Native and Expo. On top of console logs, zero config debugger, it also brings third-party tools like React Query DevTools or Redux DevTools.
You can:
- adjust the device settings on the fly,
- switch between light and dark modes,
- change the system text size to test UI responsiveness,
- simulate biometric authentication,
- develop components in isolation,
- easily navigate an expo router project,
- record the screen,
- set device geolocation,
- visualize React renders and many more.
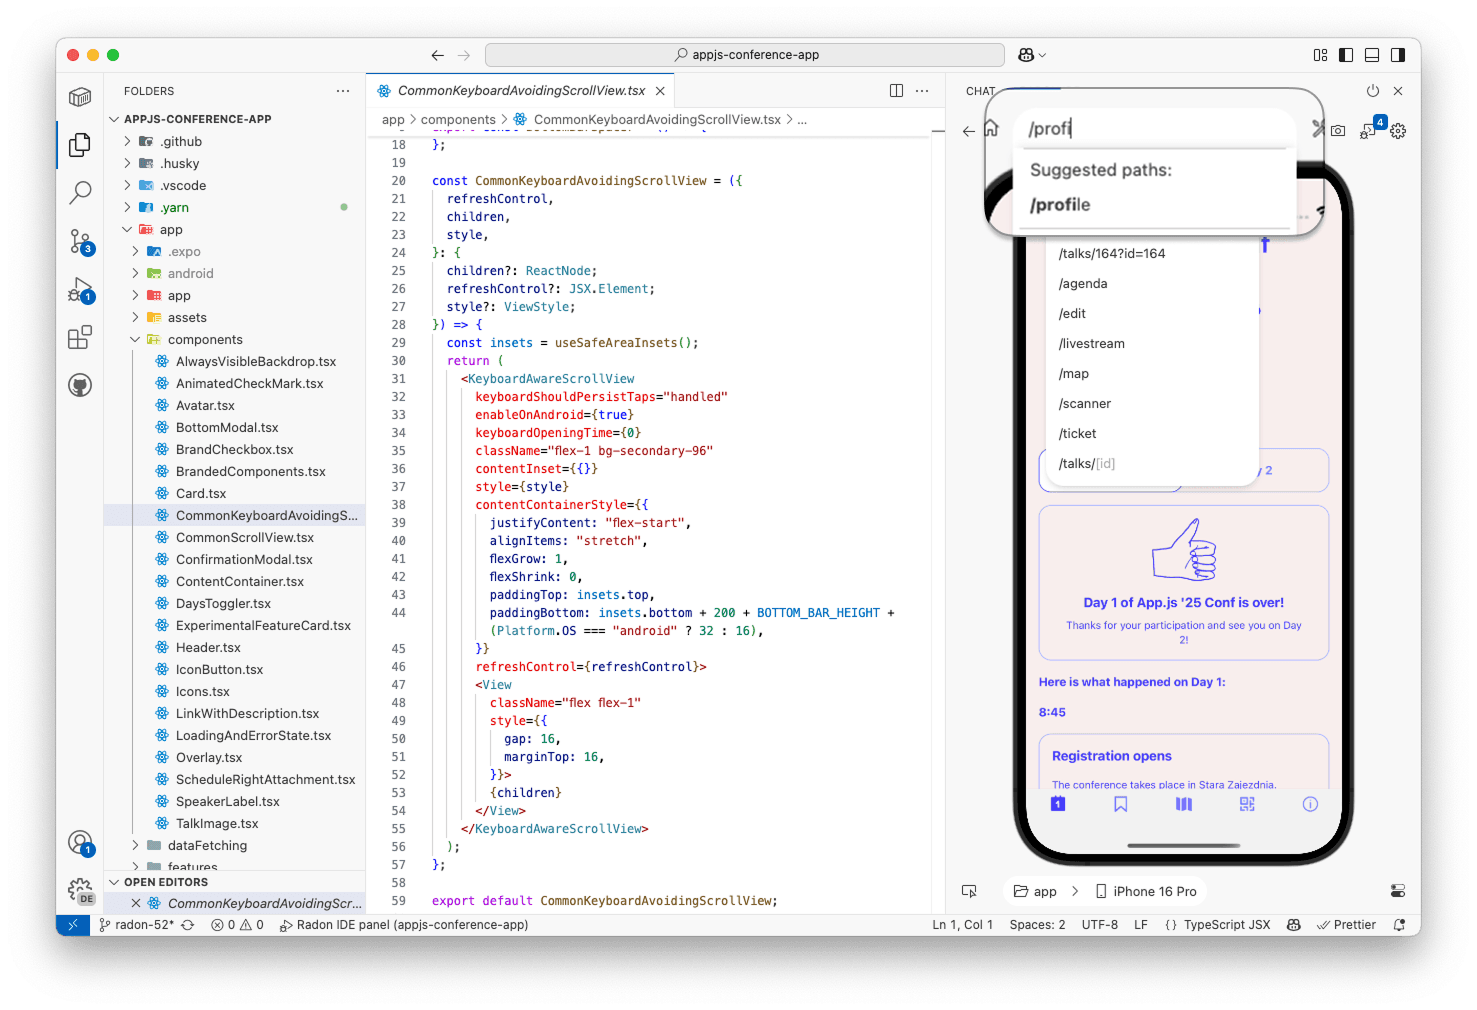
My favorite feature of Radon IDE is the Element Inspector, which allows you to quickly explore a new code base by pointing at the device preview to jump to the code where the component was used. Bonus points for logs that lead to the exact line in the code where they were called.
Radon IDE is an all-in-one tool created to make it easier to develop React Native apps, minimize context switching, and streamline debugging.
As one of the main engineers behind Radon IDE at Software Mansion, I can safely say we built it out of pure necessity. As React Native developers ourselves, we knew the community kept hitting the same tooling issues — so we decided to build something that just works. Today, developers on our team use Radon IDE daily across both client and internal projects, and it’s become a core part of how we build production-ready React Native applications. Radon IDE comes with a free 30-day trial, so you can try it out and see the difference for yourself.
Native platform tools: Xcode & Android Studio
When it comes to debugging the native part of a React Native application, nothing compares to the native tooling for a specific platform, because, as we all know, React Native is native.
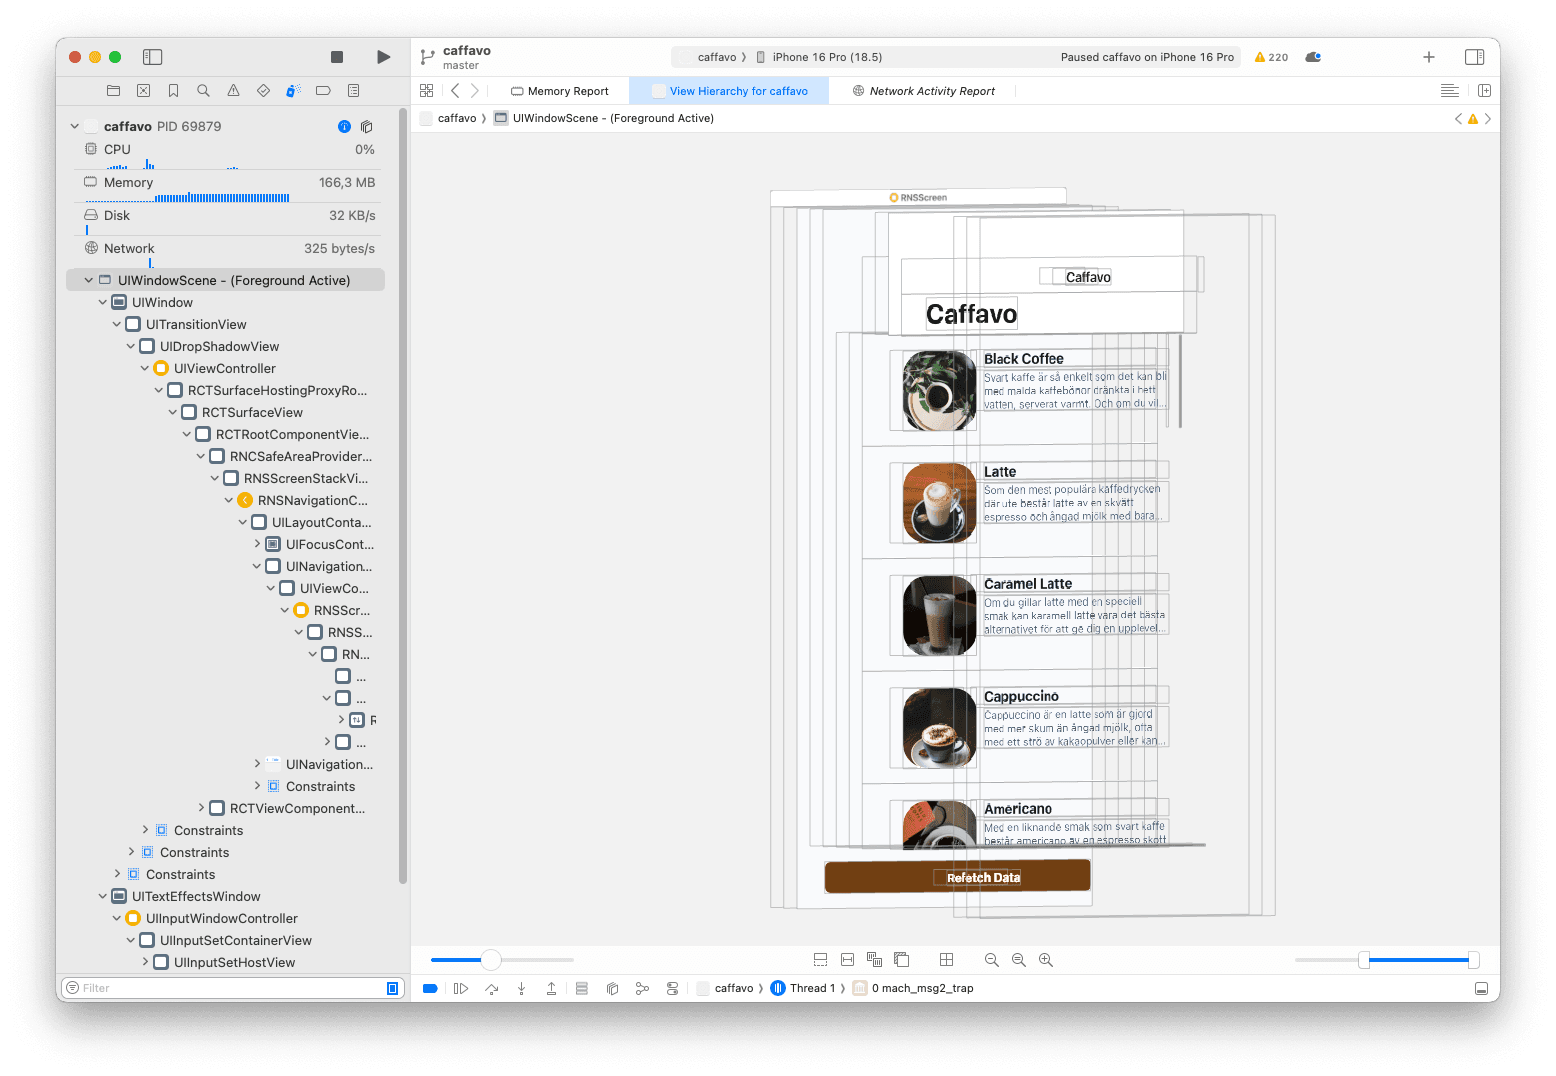
Xcode is the undeniable king when it comes to debugging iOS applications. You can step through the native code and inspect variables thanks to the powerful LLDB debugger, view a real-time overview of CPU and memory usage while your app is running, and keep an eye on the disk and network consumption.
An amazing View Hierarchy debugger provides a 3D, exploded view of all the native UI components on the screen, helping you identify layout issues, overlapping elements, or incorrect view properties that might not be apparent from your React Native code alone.
Android Studio’s Layout Inspector serves the same purpose as Xcode’s View Hierarchy, but unlike View Hierarchy which pauses the app, the Layout Inspector works on a running application.
When it comes to diagnosing performance issues in your Android app, the Profiler is a fundamental part of your toolkit. You can analyze the memory usage by inspecting the heap dump which is incredibly useful to find memory leaks. In addition, it is possible to debug JVM (Java/Kotlin) allocations via Track Memory Consumption as well as record the CPU callstack snapshots thanks to the CPU Hotspots tool. Naturally, it also includes a powerful debugger allowing you to set breakpoints and examine variables in Java/Kotlin code. You can read more about profiling Android applications in the official Android Studio documentation.
Obviously, the native tools have no idea about the React code running inside the application. For this reason, it’s not possible to debug the JavaScript side of the app, which contains most of the business and view logic. In short, Android Studio and Xcode should be used alongside other React Native debugging tools, not instead of them.
So, what’s the best React Native debugging tool?
Ultimately, the best tool is the one that fits the specific problem you’re trying to solve. Here’s a quick comparison of the React Native debugging tools listed in this article:
Returning to our running analogy, React Native DevTools would be a pair of modern, everyday training shoes, but sometimes you need specialized gear. I’d think of Radon IDE as high-tech marathon running shoes (Nike Alphafly, anyone?) which make you a more effective and efficient developer. And when the trail gets really rocky, you reach for Xcode and Android Studio.
At the end of the day, the goal of using debugging tools isn’t just to fix bugs, but to build a seamless workflow that lets you focus on what truly matters: creating great applications.
Need help with your project or want to discuss how Radon IDE can improve your workflow? Reach out to me on X or Linkedin.
We’re Software Mansion: multimedia experts, AI explorers, React Native core contributors, community builders, and software development consultants.