
We Built the Same App in Flutter and React Native – Here's What We Found
 Mateusz Wygonny
 Szymon Banyś
TL;DR
On Android, Flutter ships an app less than half the download size of React Native's and cold-starts about twice as fast on budget phones. On iPhone the story flips: React Native holds two to three times less RAM.
We built the same Pokémon app in both frameworks and measured it across six phones. There's no universal winner, so we're giving you the hard data to decide which framework fits your app.
The apps
To compare the technologies, we created a simple app listing Pokémon. We made one for both Flutter and React Native. Both apps fetch data from the PokéAPI and present a list of Pokémon that can be interacted with to see further details. This makes a good base for modern app testing – we fetch data, deal with lists and local persistence, load images, and navigate between tabs.
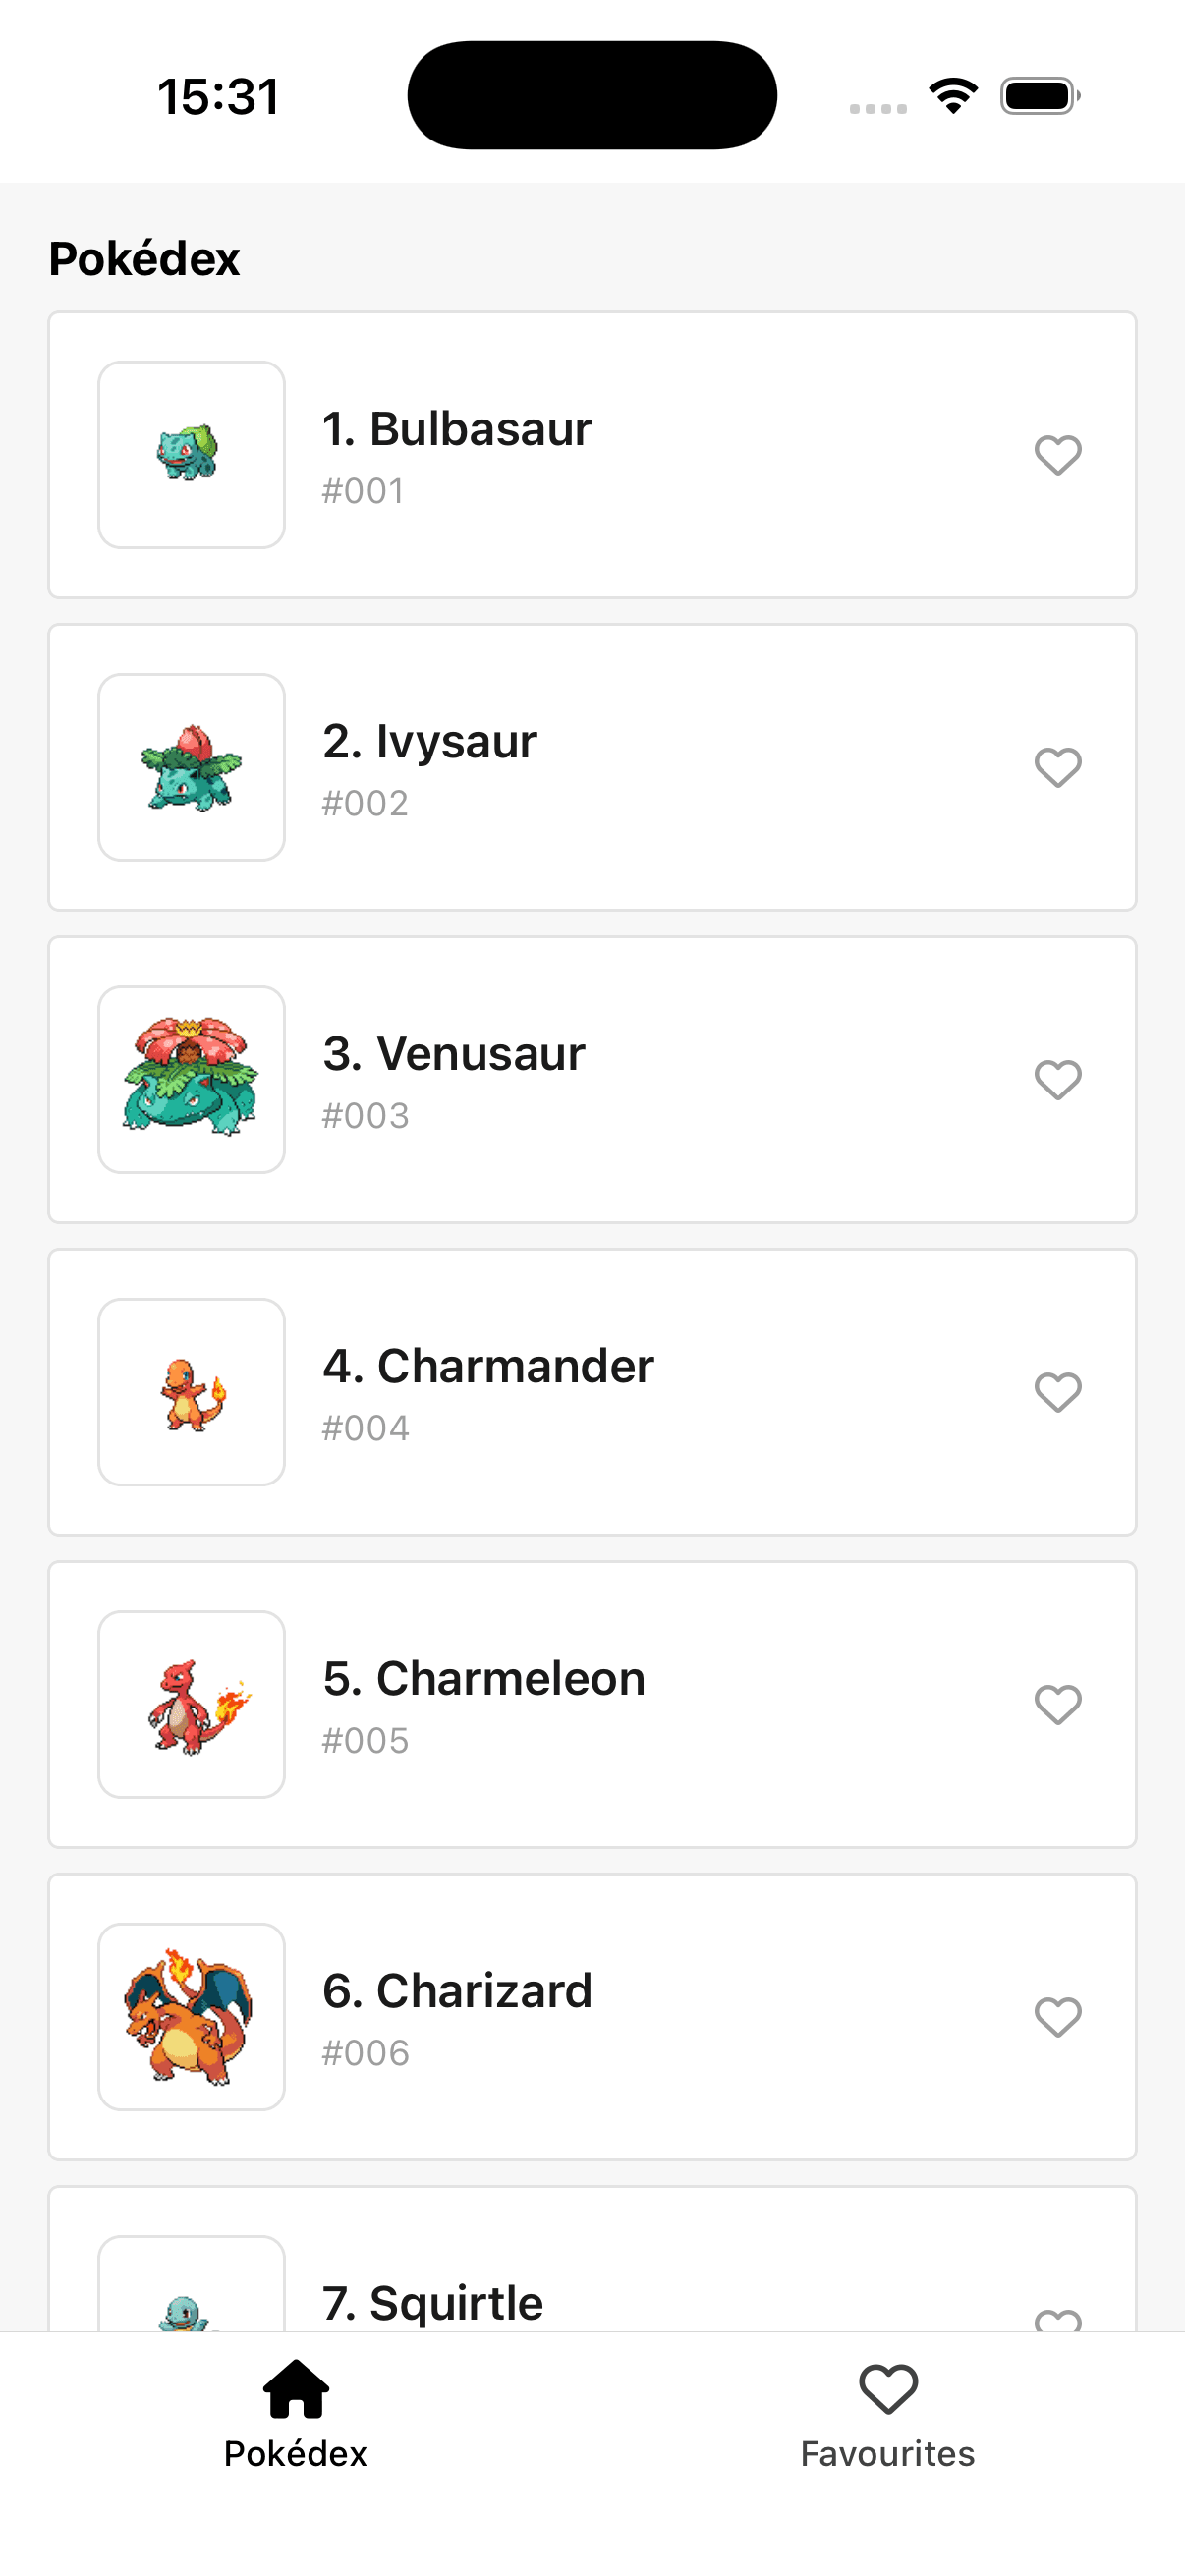
The app consists of three key components:
Pokémon – a scrollable list of Pokémon, showing an image, name, and attack types.
Favorites – a view displaying favorite Pokémon, handled through local persistence.
Detail sheet – a modal bottom sheet showing further details of the Pokémon.
It's important to note that both implementations are baseline and were not fully tuned for production. This gives an idea of what is available out of the box rather than what's possible with extensive optimizations.
Differences between the Flutter and KMP comparisons
The SpaceX API used in the Flutter vs KMP comparison was unfortunately disabled soon after the release of the previous article. Consequently, we had to switch to a different API. We ended up with the open PokéAPI, which allows fetching Pokémon with their images and other details. The structure of this API is different from that of the SpaceX API, which causes practical differences in the structure of the app and tasks.
Gradual expansion of the bottom sheet was disabled, so there's an interaction as a middle step to view the whole data.
There are more items in the API, so reaching the end of the list causes more data fetching.
As there's no summary endpoint as in the SpaceX API, we have to fetch details of all creatures on the home screen — this means more requests at the beginning but cached requests when getting details for the bottom sheet.
These differences mean that, at this point, an absolute comparison between all three technologies won't produce reliable results. The RN app tested against Kotlin is different from the RN app tested against Flutter. However, where possible and sensible, we may try to comment on relevant patterns.
Tech stack
Flutter
It's worth noting that as of Flutter 3.27, Skia is no longer used as the rendering engine. Instead, Flutter uses a custom-made Impeller engine.
Flutter 3.44.1 (Dart 3.12)
Dio 5.10.0 – networking
Riverpod 3.3.2 (flutter_riverpod) – data fetching, caching, and favorites state
cached_network_image 3.4.1 – image loading
go_router 17.3.0 – navigation
shared_preferences 2.5.5 – favorites persistence
React Native
React Native 0.81.5 on Expo 54.0.33
Axios 1.13.6 – networking
TanStack React Query 5.90.21 – data fetching and caching
Zustand 5.0.12 – favorites state
Expo Image 3.0.11 – image loading
Expo Router 6.0.23 + React Navigation 7.1
Test scenario
Initial interaction – open the first item and save it to the database by marking it as favorite.
Mid-list scroll and render – rapidly scroll to the 25th item, interact with the UI, and toggle the favorite status.
Fetch more data – scroll to the 50th item (the number of items received with the initial request). This triggers multiple renders with images as well as a request for more items.
State and database management – navigate to the 'Favorites' tab and remove all saved items from the database.
Reset – navigate back to the primary list and return the scroll position to the top.
Test devices
We conducted the measurements across a diverse set of six devices. We report results on a per-device basis to highlight hardware-specific performance variance. We aimed to split the devices into low, mid, and high end, but the performance of iOS and Android phones is not matched – the mid-tier iPhone is faster than the mid- and high-end Android devices, but that's not a problem. We're focused on measuring the difference in performance between Flutter and React Native rather than between Android and iOS; repetition across a range of devices simply provides better insight into how device specs affect those technological differences.
Android
- Motorola G15, 2024, Helio G81, 8GB – low
- Xiaomi Redmi Note 15, 2025, Helio G100 Ultra, 8GB – mid
- Samsung S23, 2023, Snapdragon 8, 8GB – high
iOS
iPhone SE (2nd gen), 2020, A13, 3GB – low
iPhone 16e, 2025, A18, 8GB – mid
iPhone 17, 2025, A19, 8GB – high
The challenges of profiling
We based the methodology for the benchmarks on the previous Kotlin and React Native comparison. There, it was discovered that using automation tools like Maestro introduces too much noise into the data.
That's why the test scenarios were performed manually, while the CI captured relevant data from CPU and RAM runs. Startup times were fully automated, however, as they required no complex interaction.
To get an accurate performance benchmark, we repeated each reading ten times and captured the average.
App size: Flutter vs React Native
App size doesn't affect performance but may influence a user's decision to download the app. That's why we measured both download size and size after installation. Obviously, the smaller the size, the better – especially for the download size.
| Platform | Framework | Build size (MB) | Download size (MB) |
| Android | Flutter | 17.3 | 8.0 |
| Android | React Native | 33.5 | 15.8 |
| iOS | Flutter | 17.0 | 7.1 |
| iOS | React Native | 29.7 | 9.2 |
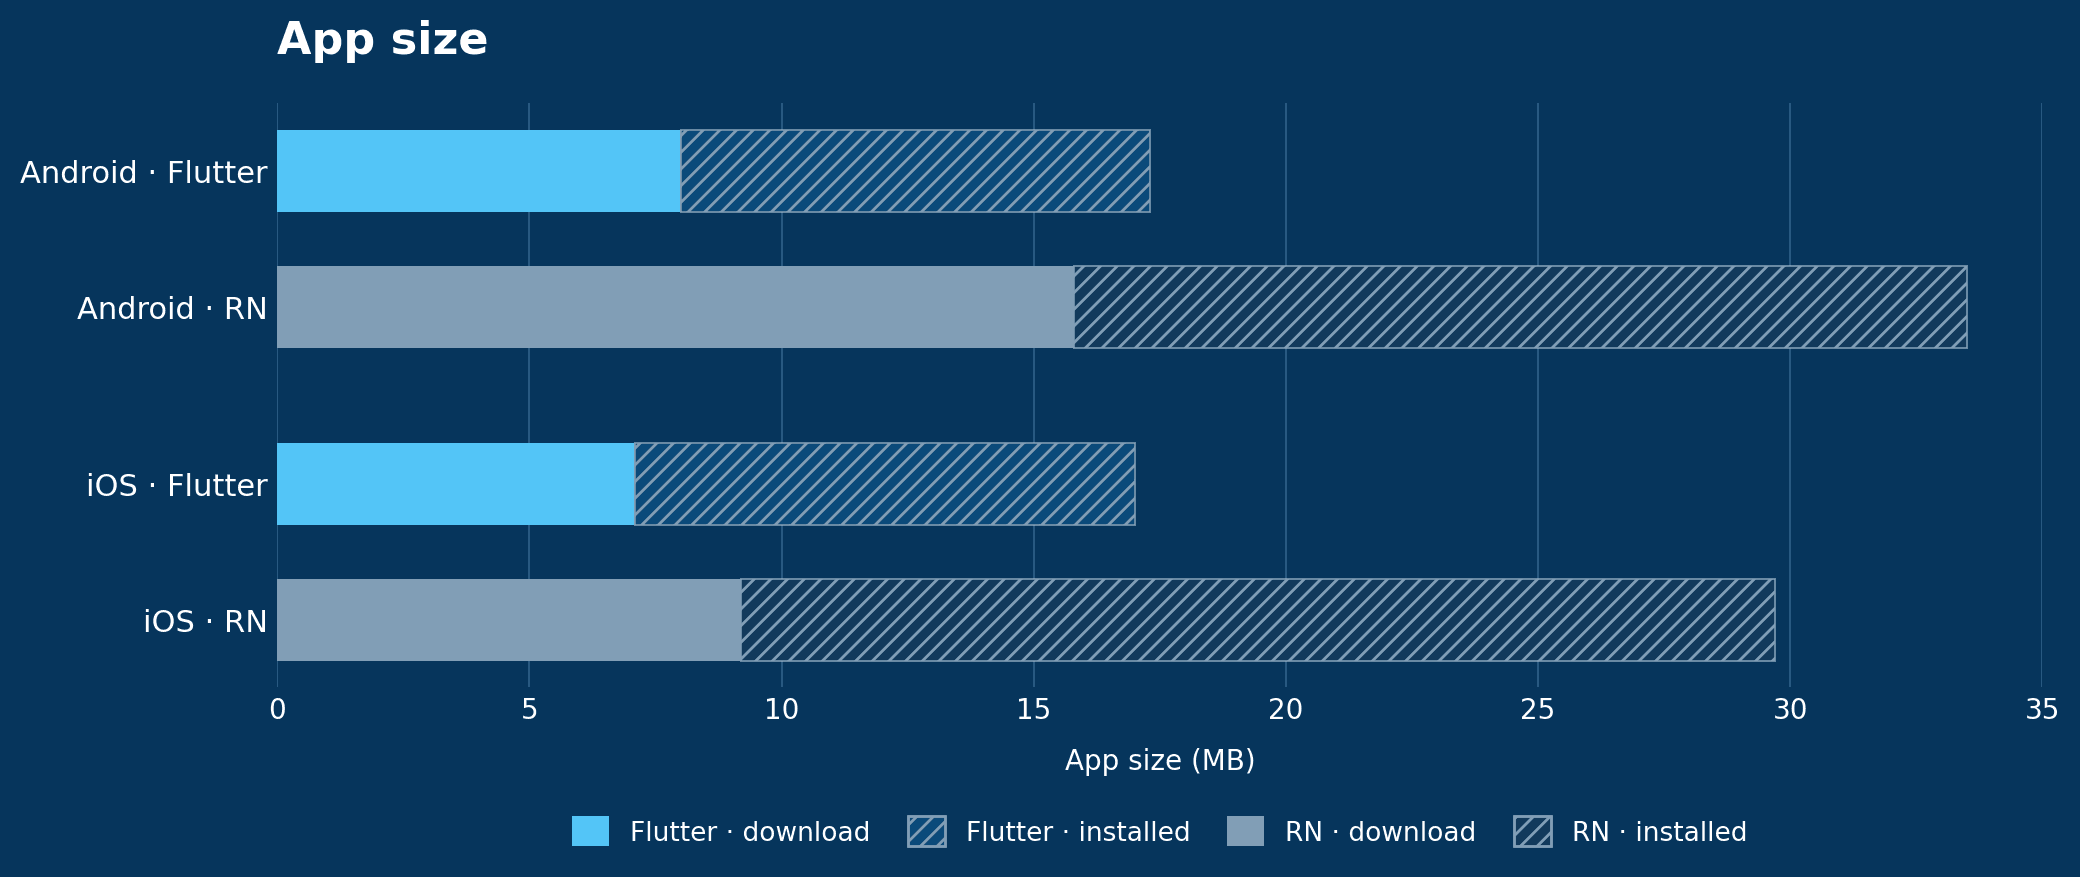
For Android, we created builds with a release configuration, R8 + ProGuard shrinking, and obfuscation enabled. On top of that, only a single ABI (arm64-v8a) was included so that framework size is not conflated with multi-arch shipping decisions. We then inspected the produced APK with Android Studio's APK Analyzer.
For iOS, we created builds with a release configuration and the Debug Executable disabled, giving realistic, production-like data. We then analyzed the App Thinning Size Report generated by Xcode during the export process.
The download size of the apps is close, with Flutter being universally smaller. The size advantage compounds post-installation, where Flutter expands by a factor of around 2.5 and React Native by a factor of 3.5. As Flutter starts smaller and expands less, it's a clear winner here.
Startup time: which launches faster?
What We Measure
TTID (Time to Initial Display) – measured from the launch tap to the first rendered frame of the UI.
TTFD (Time to Full Display) – measured from the launch tap to the point where the app has loaded its content and is fully interactive.
How we measured
Startup time is measured across two distinct milestones: TTID and TTFD. Both are captured per cold start, meaning the app is fully terminated before each measurement. However, on iOS we observed that the first launch in a sequence is the slowest if we immediately force-terminate the app and relaunch it. This might mean that despite the app being closed, some of its data remained cached. Adding a five-minute cooldown period between readings fixed that. A similar effect was observed on Android; however, the cooldown didn't fix it there. We considered reinstalling the app between launches but ultimately decided against it, as it would introduce its own problems, and accepted the potential bias on Android – ultimately, our method still falls within the definition of cold-start testing, but it's good to keep that in mind.
The methodology for capturing data is exactly the same as in the previous article.
For Android, the am start -S -W command drives each cold start and blocks until the first frame is rendered, returning TTID directly.
adb shell am start -S -W <package>/.MainActivity \
    -c android.intent.category.LAUNCHER \
    -a android.intent.action.MAIN
TTFD is read from logcat, where Android emits a "Fully drawn" log entry after the app calls reportFullyDrawn(). This function is invoked once the UI has finished loading all content – in this case, when the launch list data request settles with either a success or an error.
adb logcat -d | grep "Fully drawn <package>"
For iOS, the measurement uses xctrace with the App Launch template and the Points of Interest instrument:
xcrun xctrace record \
  --template "App Launch" \
  --instrument "Points of Interest" \
  --output startup.trace \
  --device <UDID> \
  --time-limit 5s \
  --launch -- <bundle_id>
The trace is then exported to XML, filtering for the os-signpost table in the PointsOfInterest category:
xcrun xctrace export \
  --input startup.trace \
  --xpath '/trace-toc/run[@number="1"]/data/table[@schema="os-signpost"][@category="PointsOfInterest"]' \
  --output signpost.xml >/dev/null 2>&1
The app instruments itself with os_signpost events named TTID and TTFD, each emitted at most once per session. The event-time field in each matching row is nanoseconds since the trace start, which equals the startup duration, because the trace begins at process creation. We extract each value with:
# TTID
xmllint \
  --xpath '//row[signpost-name[@fmt="TTID"]]/event-time/text()' \
  signpost.xml


# TTFD
xmllint \
  --xpath '//row[signpost-name[@fmt="TTFD"]]/event-time/text()' \
  signpost.xml
The general method is as follows:
1. Force-terminate the app
2. Start recording
3. Launch the app
4. Record TTID when the first frame appears
5. Wait for the TTFD signal
Android
| Device | Flutter TTID | RN TTID | Flutter TTFD | RN TTFD |
| Moto G15 | 470 | 1114 | 548 | 1464 |
| Redmi Note 15 | 560 | 1110 | 677 | 1403 |
| Galaxy S23 | 240 | 428 | 349 | 522 |
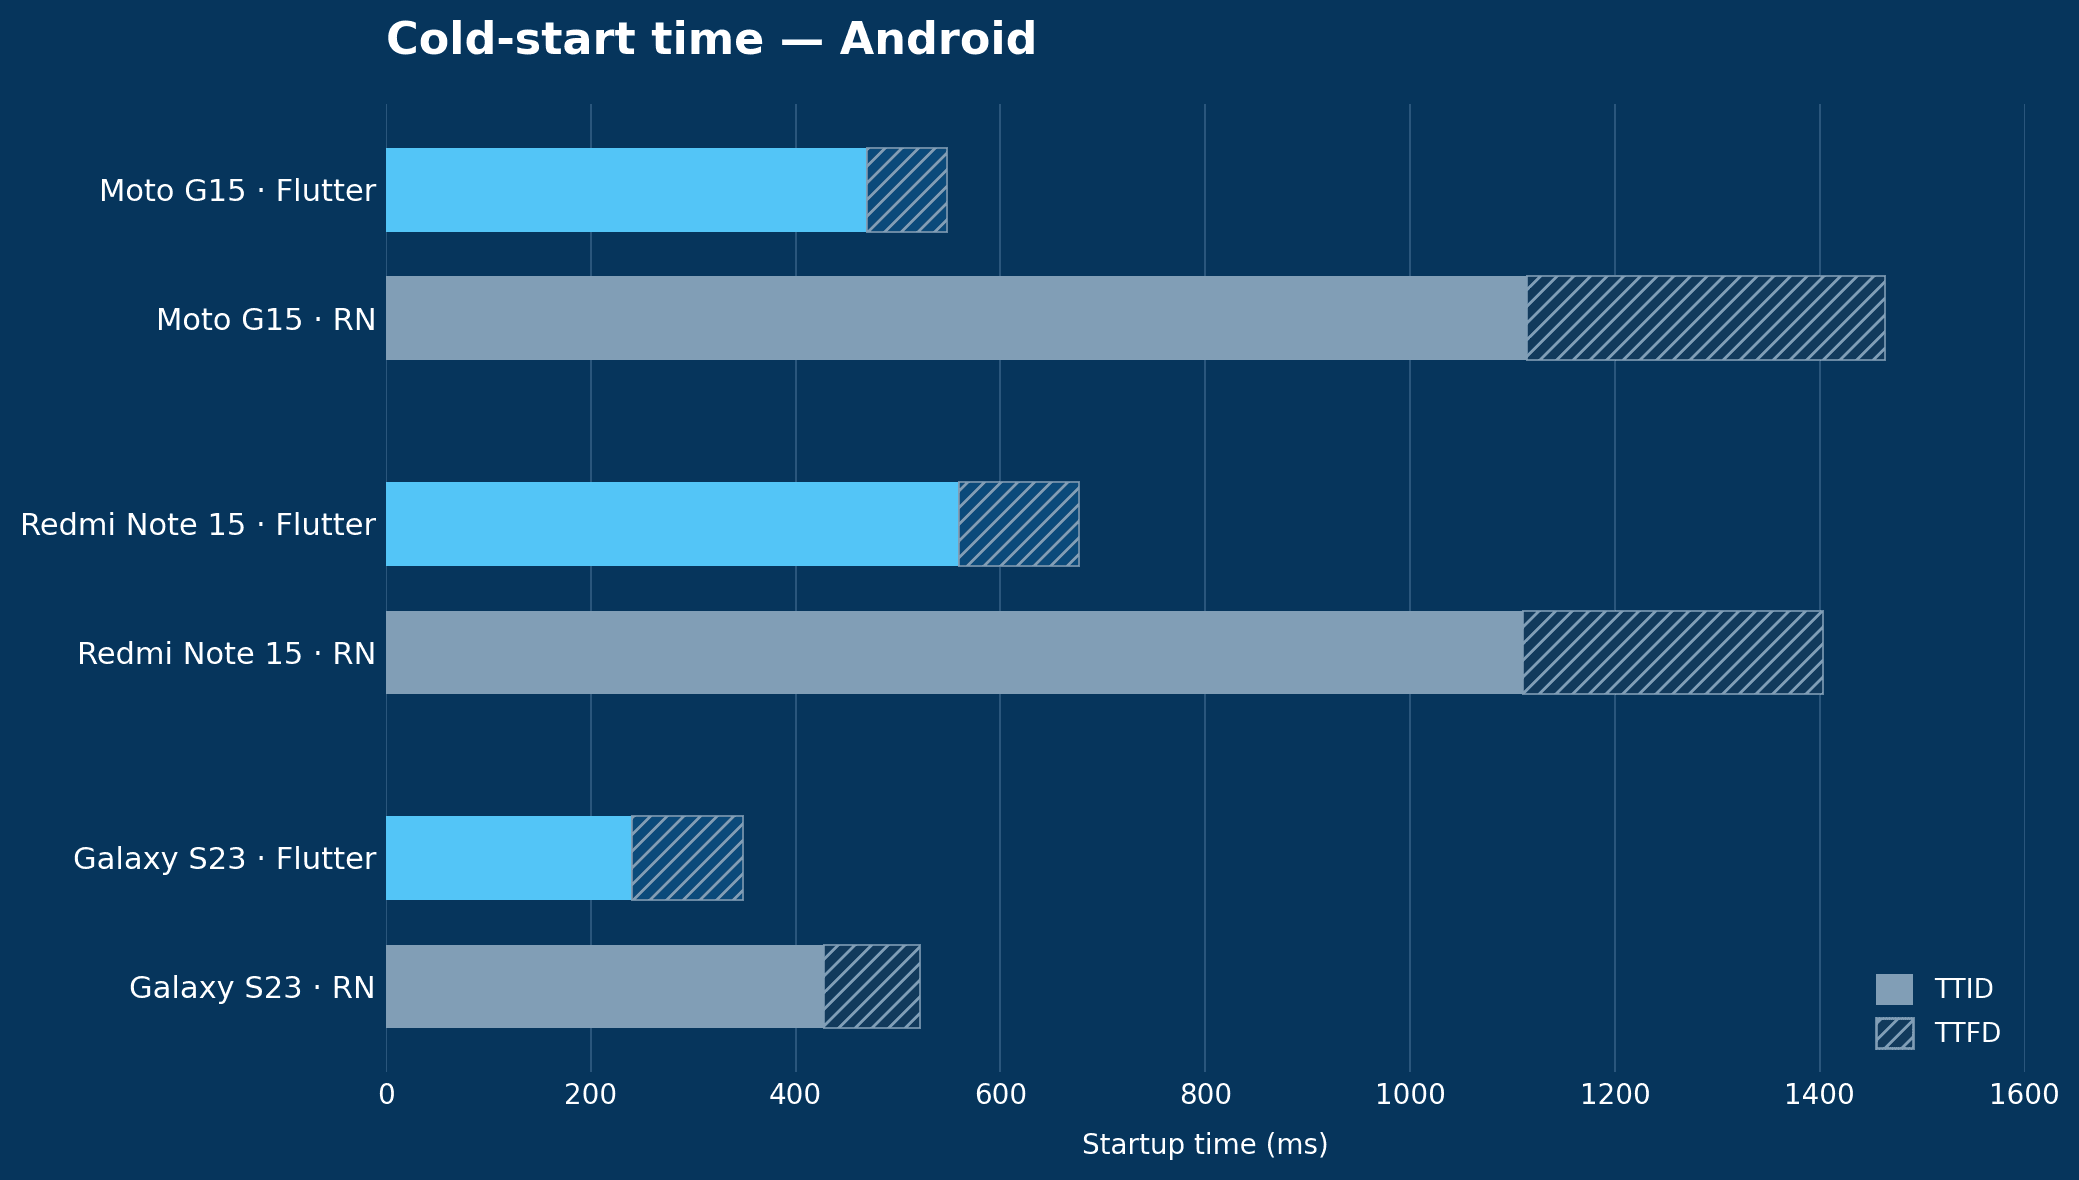
On Android, Flutter apps launch faster, especially on older devices. However, with modern phones the gap tightens (though it's still present).
iOS
| Device | Flutter TTID | RN TTID | Flutter TTFD | RN TTFD |
| iPhone SE (2nd gen) | 1128 | 1260 | 1282 | 1445 |
| iPhone 16e | 890 | 888 | 1178 | 1231 |
| iPhone 17 | 760 | 799 | 837 | 886 |
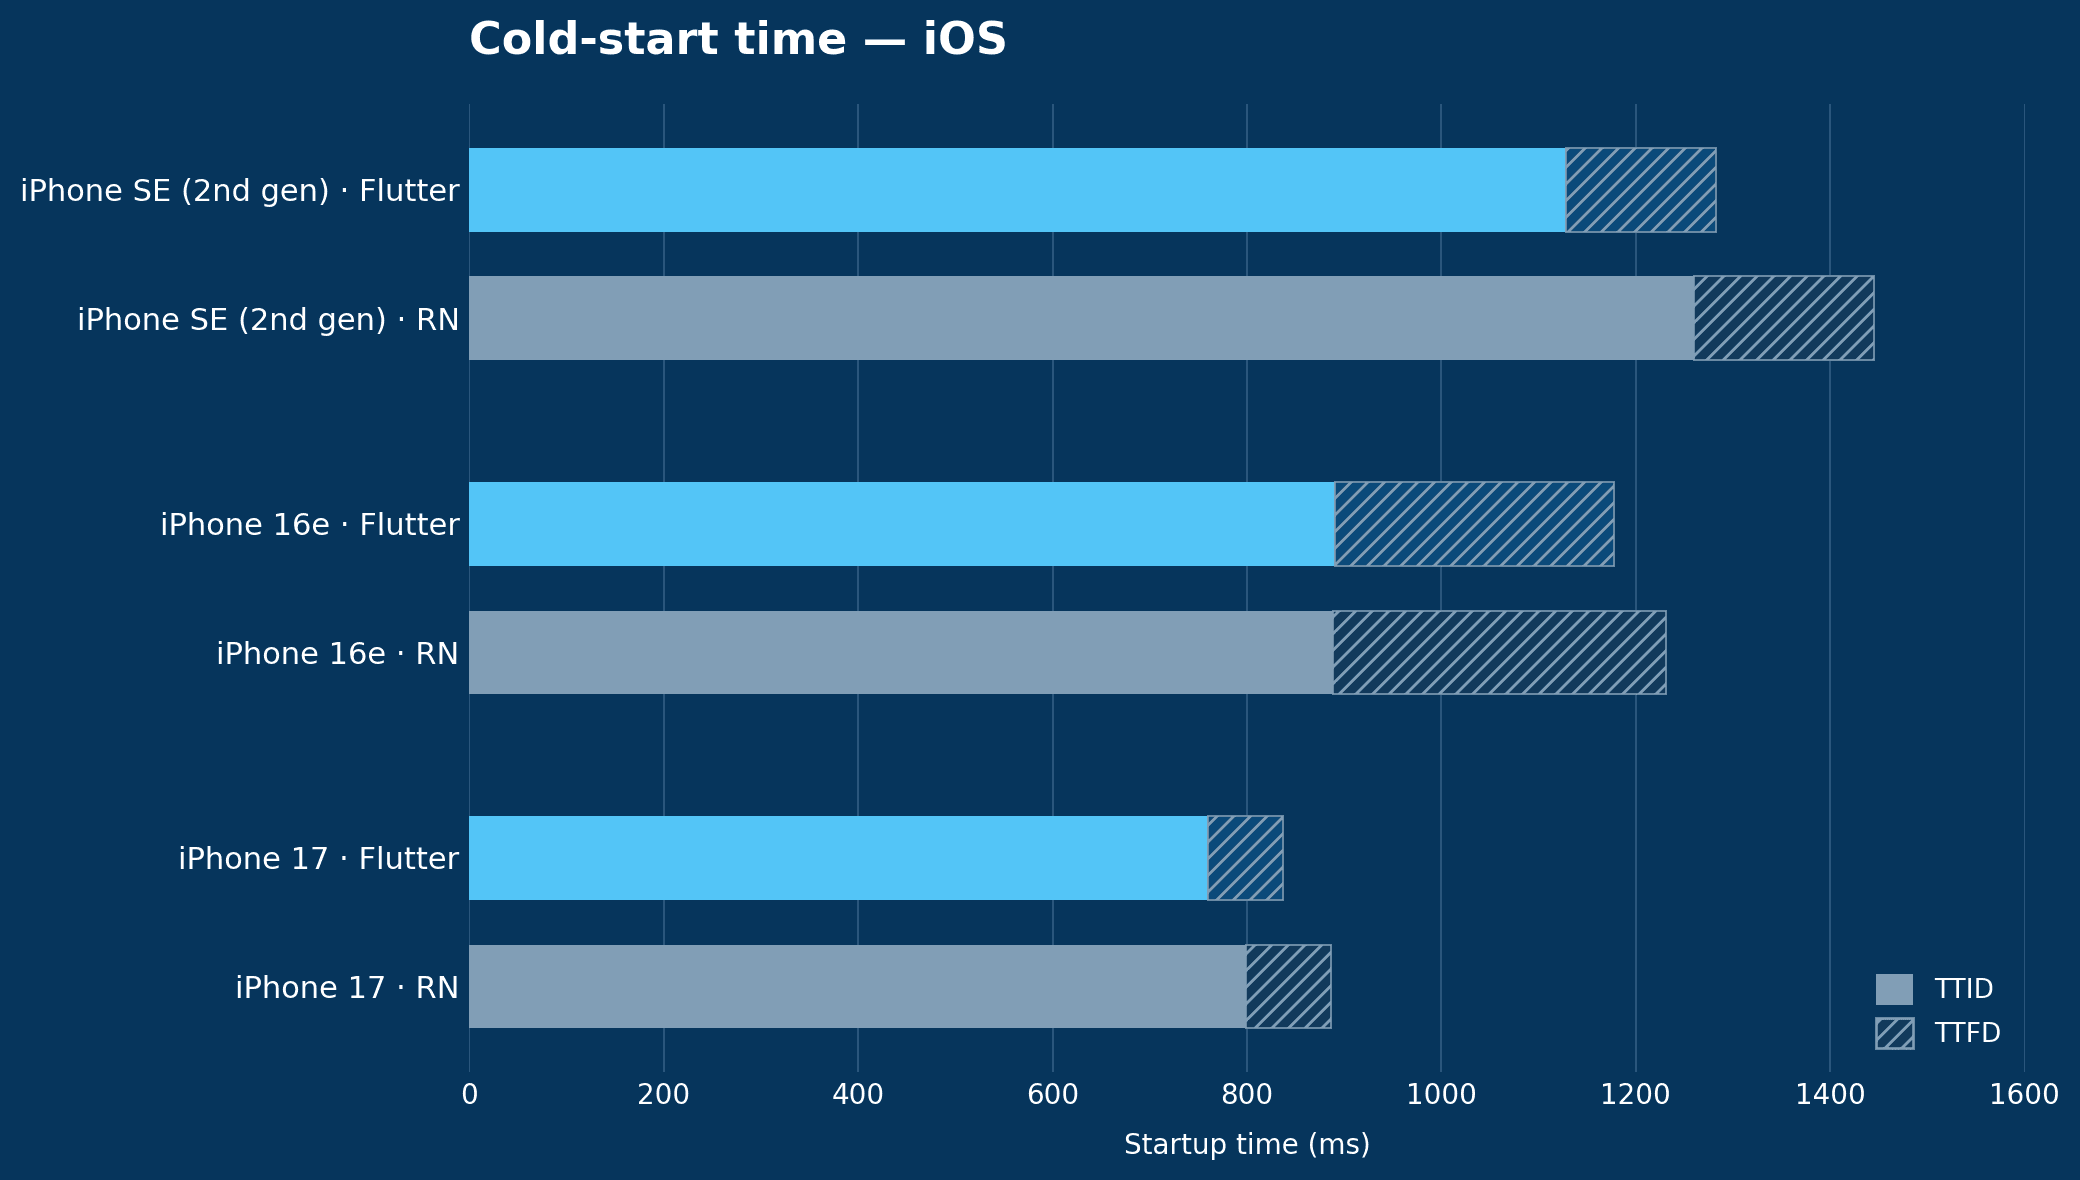
On iOS, the situation is different. Both React Native and Flutter take roughly the same time to launch. There's a minor difference in favor of Flutter on the iPhone 17 and iPhone SE2, but relative to the total startup time, it's very small.
RAM usage: which uses less memory?
RAM measurement is complicated by the fact that Android and iOS expose fundamentally different memory models. Android reports PSS and RSS via its kernel memory accounting; iOS exposes a Clean/Dirty/Compressed breakdown with no direct PSS equivalent and no swap.
Testing flow
The semi-automated flow was as follows:
1. Force-terminate the app
2. Start the app
3. Wait 5 seconds to allow everything to load and reduce noise (this is when data is fetched)
4. After the waiting window has passed, start measuring and manually perform the test scenario
5. Once the test scenario is completed, stop the measurements
6. Repeat until ten samples are collected
The issue with manual testing is that it's difficult to perform the test scenario the same way each time. Following the steps isn't the problem in itself – the issue is making sure they're always performed the same way, since each scroll needs the same speed and each tap needs the same delay. This is especially relevant for the CPU measurements discussed in the next section, which are already difficult to capture and very volatile.
While we weren't able to fully mitigate this issue, we increased consistency by having one person perform all readings for a given device and by learning the test scenario through a few dry runs beforehand. Any remaining noise in the data was reduced by averaging the ten trial readings, similar to the startup-time methodology.
What and how we're measuring on Android
PSS (Proportional Set Size) – the process's physical RAM footprint, with each shared library's contribution divided proportionally among all processes that have it mapped.
RSS (Resident Set Size) – the total physical RAM mapped into the process, counting shared libraries in full regardless of how many other processes use them.
We sampled dumpsys meminfo once per second while the test scenario ran:
adb shell dumpsys meminfo <package_name>
The TOTAL PSS: line in the output carries both PSS and RSS in kibibytes. We parse both values, convert to megabytes, and collect them as samples across the scenario. The reported figures are the average and maximum across all samples.
What and how we're measuring on iOS
iOS doesn't use swap. Instead, it splits memory into Clean (pageable from disk), Dirty (must be kept in RAM), and Compressed (in RAM but compressed when idle). The number reported by Activity Monitor is Clean + Dirty + Compressed – a rough RSS equivalent.
We used xctrace with the Activity Monitor template, attached to the running process:
 xctrace record \
    --device <UDID> \
    --template "Activity Monitor" \
    --output output.trace \
    --attach <process_name>
And ran the recording until the test scenario finished, then exported the trace:
xctrace export \
    --input output.trace \
    --xpath '/trace-toc/run[@number="1"]/data/table[@schema="sysmon-process"]'
The sysmon-process table contains one row per process per sample; each row carries several size-in-bytes columns, the third of which is Memory Footprint. We filter rows by process name and collect that value across all samples, then compute the average and maximum in mebibytes.
Android
| Device | Flutter PSS | RN PSS | Flutter RSS | RN RSS |
| Moto G15 | 216 | 201 | 345 | 352 |
| Redmi Note 15 | 239 | 260 | 373 | 405 |
| Galaxy S23 | 234 | 229 | 327 | 341 |
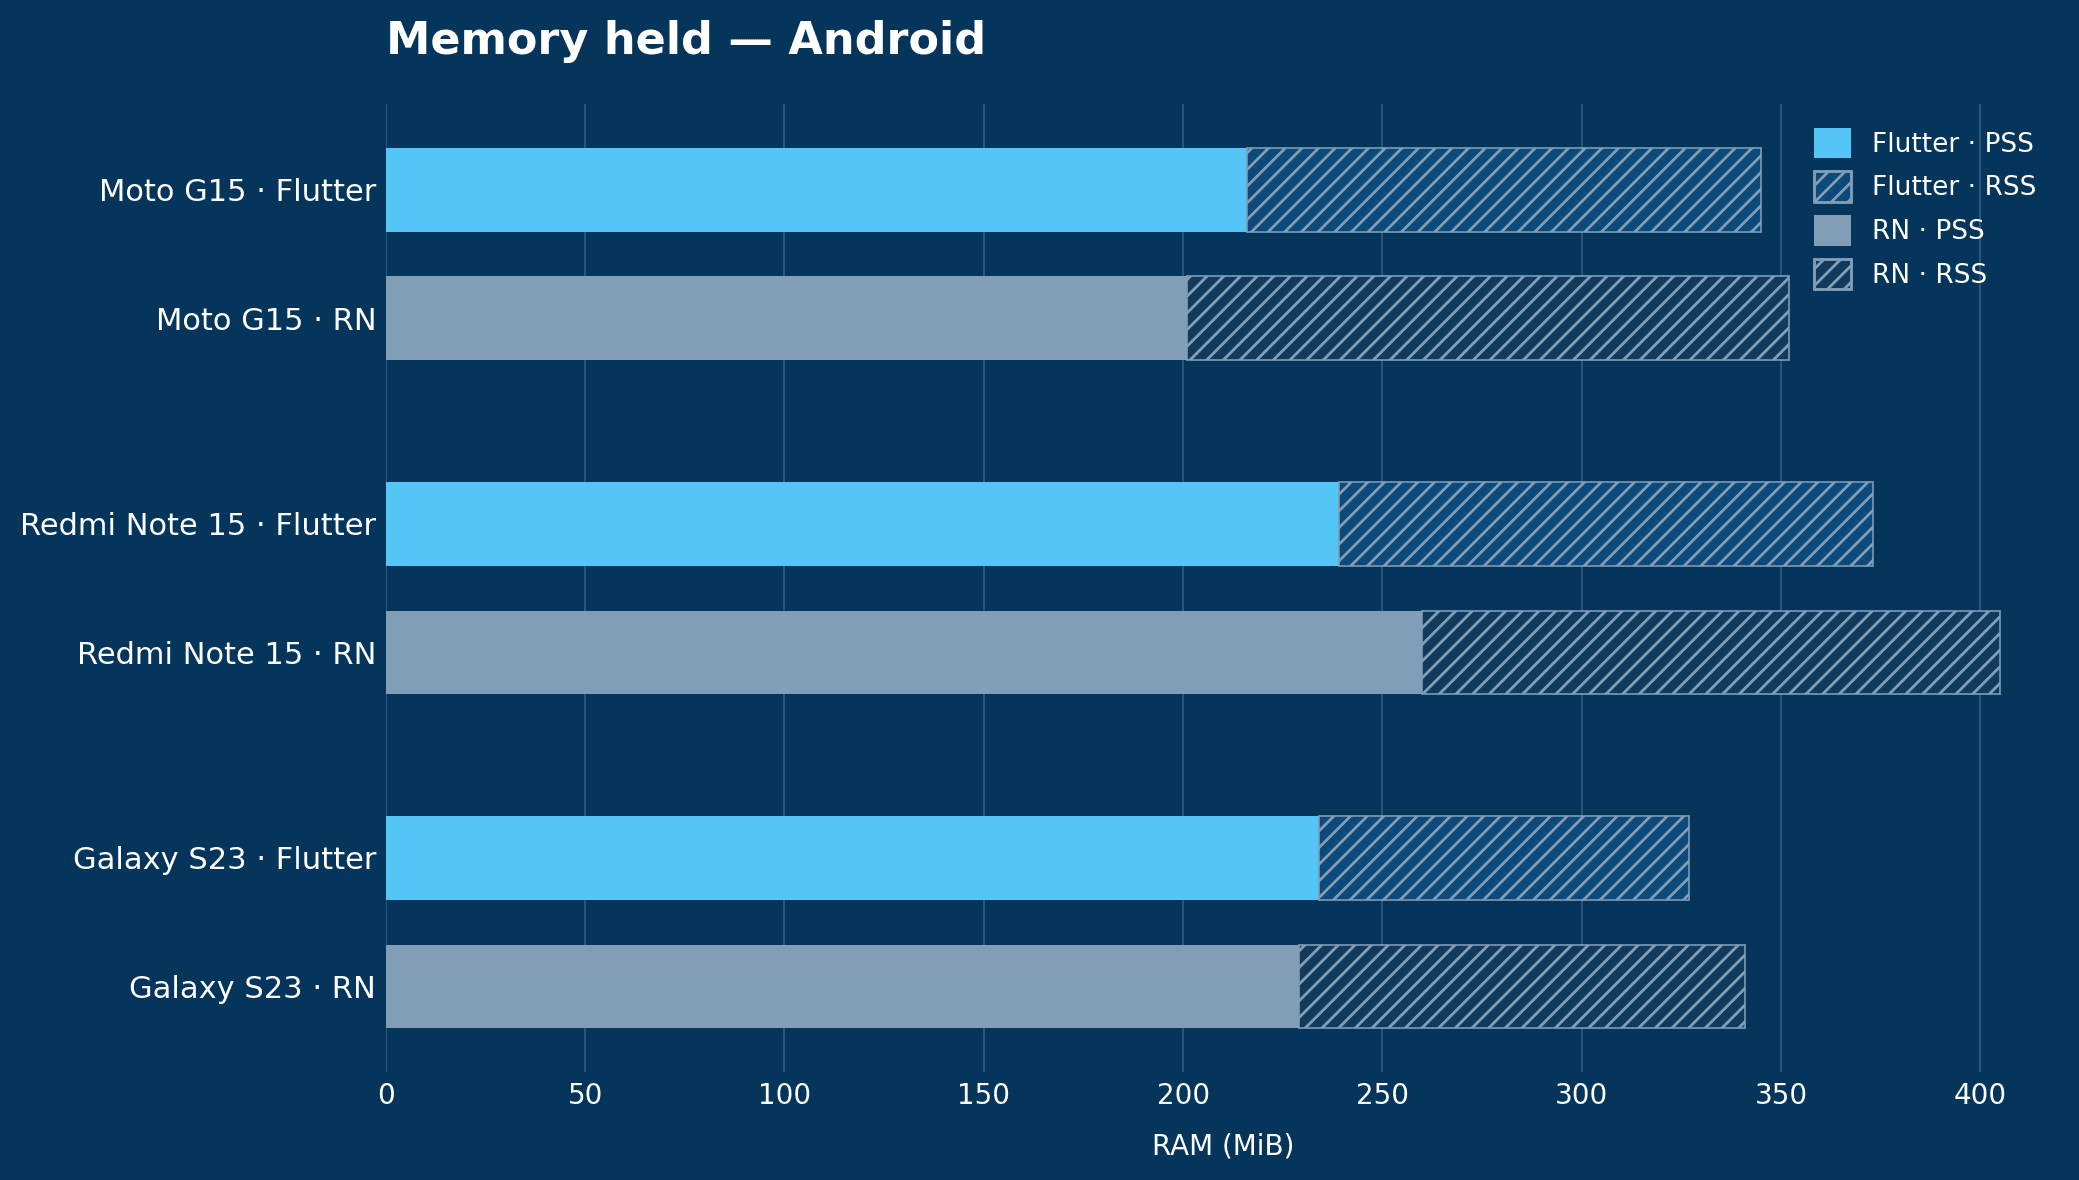
Memory use on Android devices is very similar for React Native and Flutter. On the slowest and fastest devices, Flutter uses slightly more memory; React Native uses slightly more on the mid-range device. As the differences are likely within measurement noise, and there isn't a consistent pattern favoring either technology, it's best to assume they're roughly equal in RAM usage.
iOS
| Device | Flutter avg | RN avg | Flutter peak | RN peak |
| iPhone SE (2nd gen) | 122 | 60 | 154 | 67 |
| iPhone 16e | 239 | 74 | 276 | 87 |
| iPhone 17 | 206 | 73 | 257 | 84 |
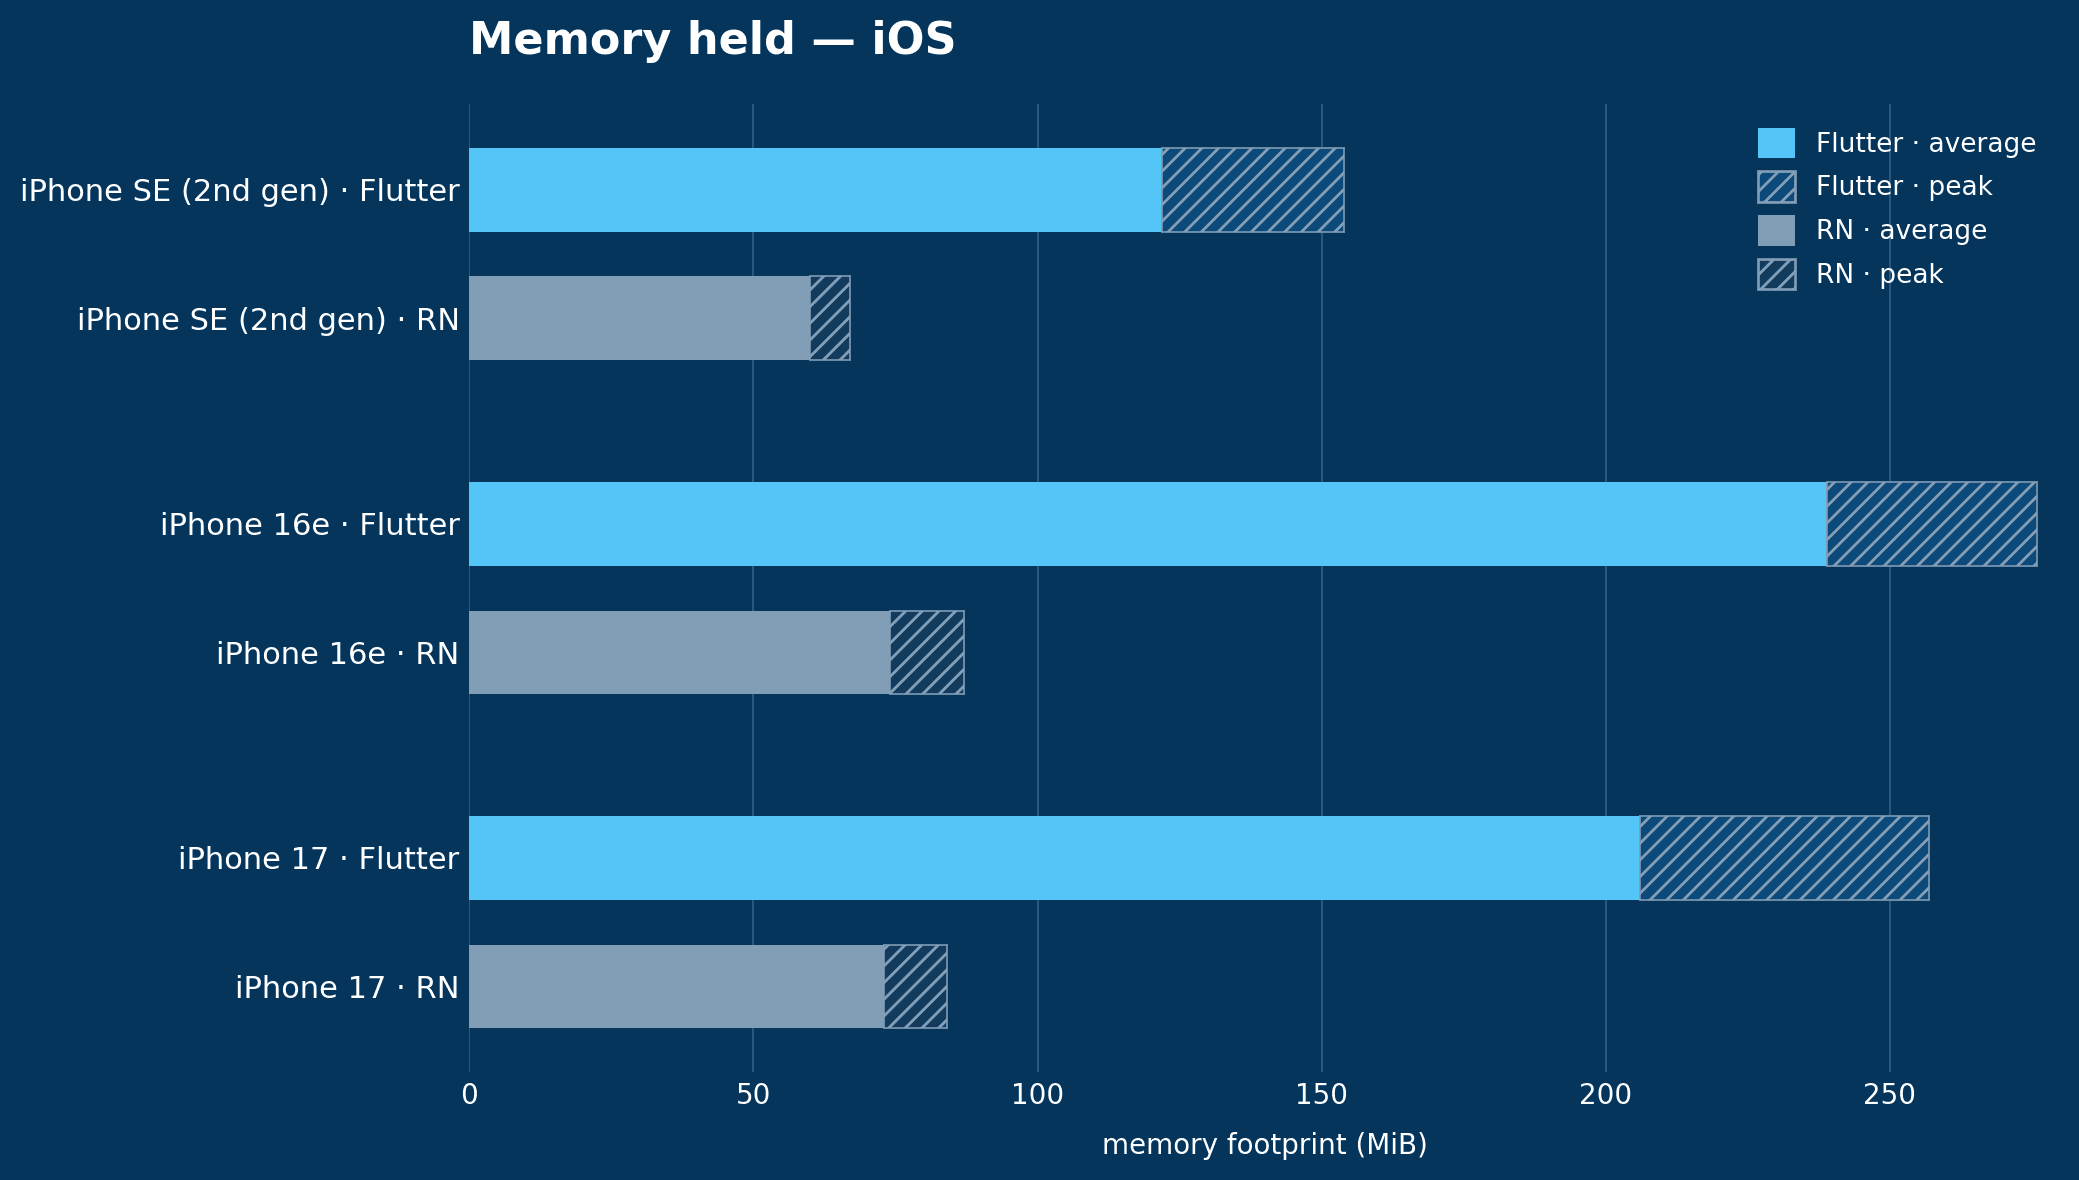
iOS paints a different picture – one that's greatly in favor of React Native. RAM usage can be up to three times smaller than in Flutter, and it's consistent across all devices.
CPU usage: Flutter vs React Native
Finding out how many cycles were used by a process can be done with tools that access hardware performance counters – special registers within the CPU dedicated to counting low-level events like branch mispredictions, cache misses, or cycles, which is exactly what we are looking for.
To get the data, we performed the same semi-automated flow as for RAM.
On Android, the counters can be read with the simpleperf stat command. To get the data from iOS, we used xctrace – the command-line equivalent of Instruments – with the "CPU Profiler" template.
Android
| Device | Flutter (G) | RN (G) | Flutter (G/s) | RN (G/s) |
| Moto G15 | 14.59 | 21.42 | 0.66 | 0.83 |
| Redmi Note 15 | 15.43 | 23.88 | 0.82 | 1.39 |
| Galaxy S23 | 10.60 | 12.02 | 0.61 | 0.72 |
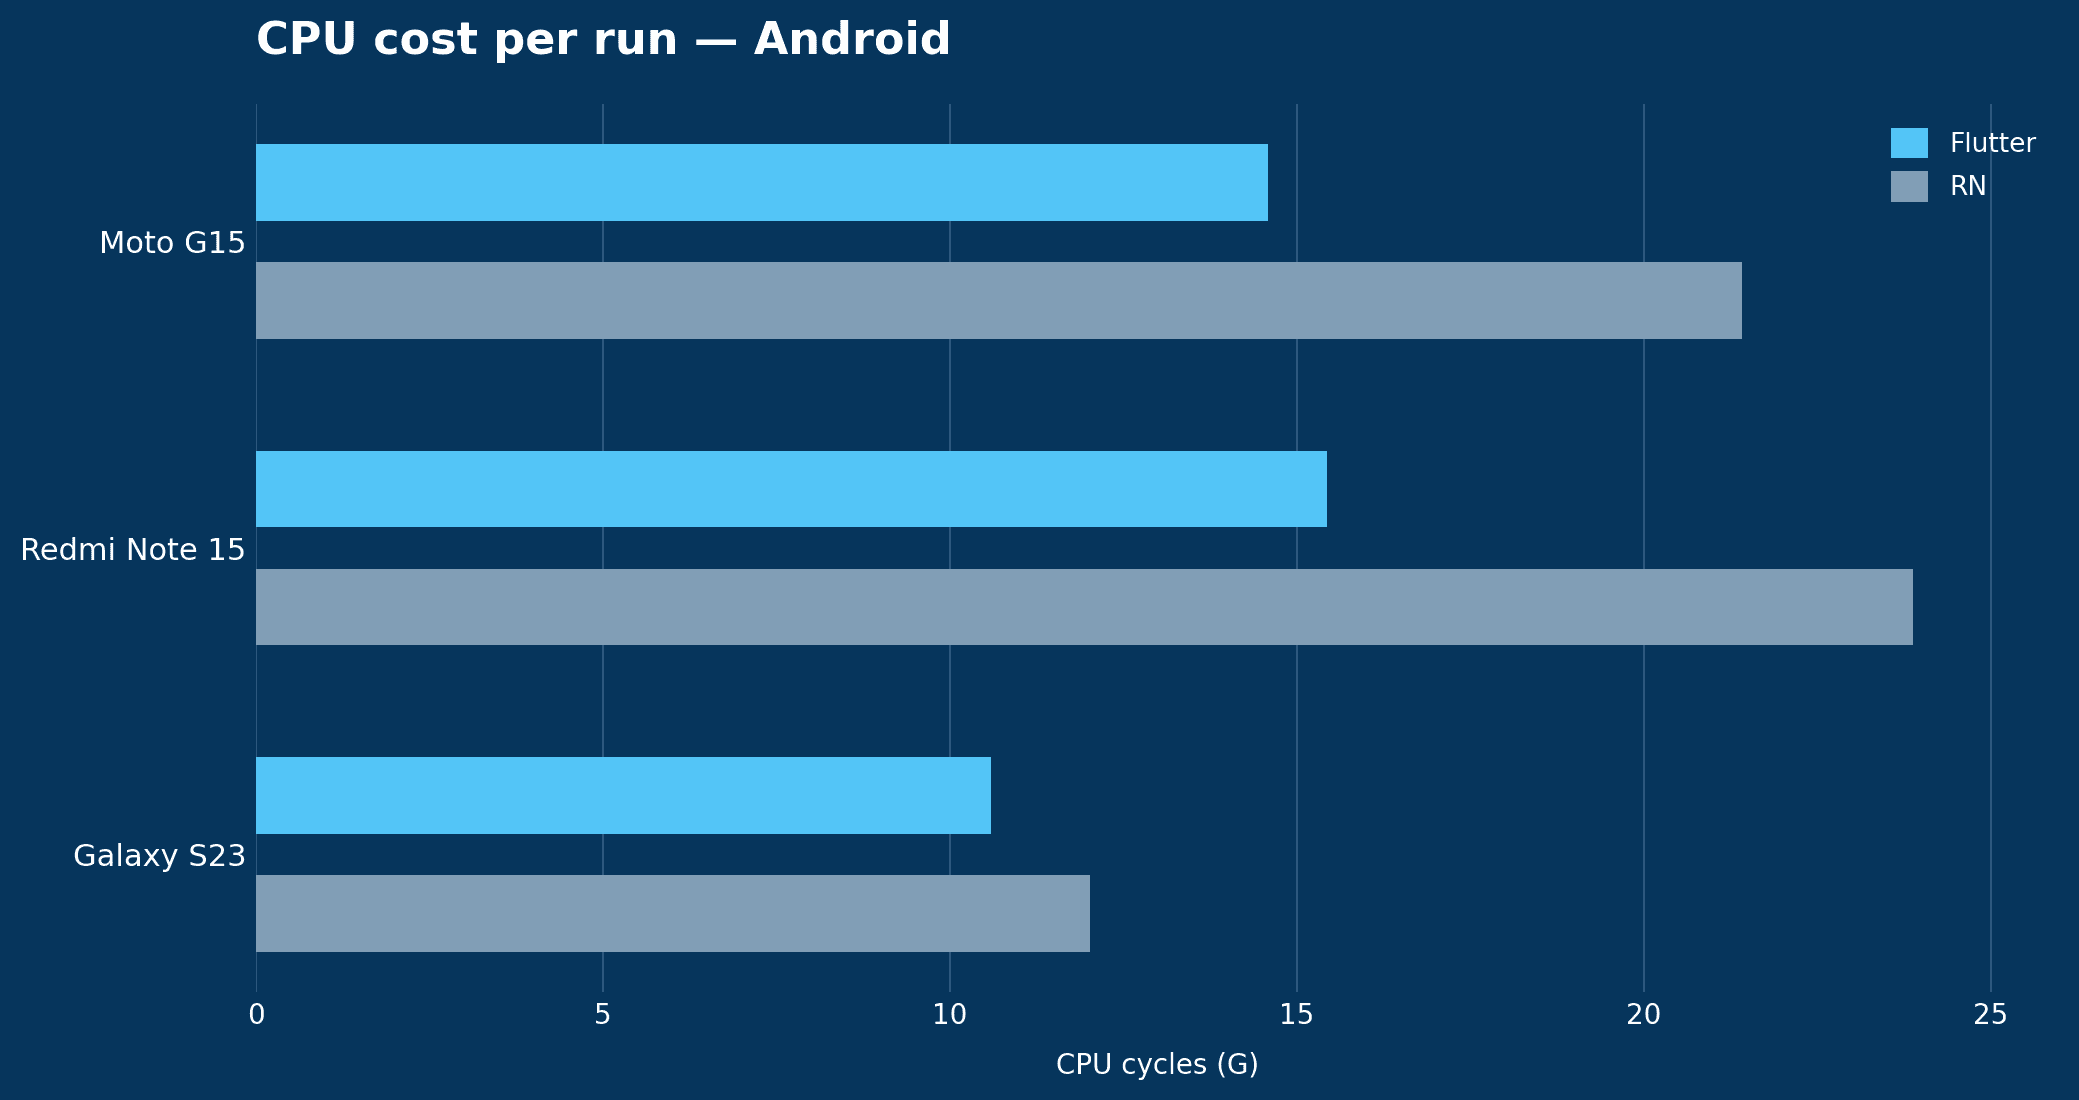
On Android, Flutter is a clear winner for low- and mid-tier devices. It's also better on the high-end device, but the difference isn't as large.
iOS
| Device | Flutter (G) | RN (G) | Flutter (G/s) | RN (G/s) |
| iPhone SE (2nd gen) | 2.28 | 5.06 | 0.12 | 0.26 |
| iPhone 16e | 1.99 | 3.79 | 0.10 | 0.22 |
| iPhone 17 | 2.13 | 4.53 | 0.11 | 0.22 |
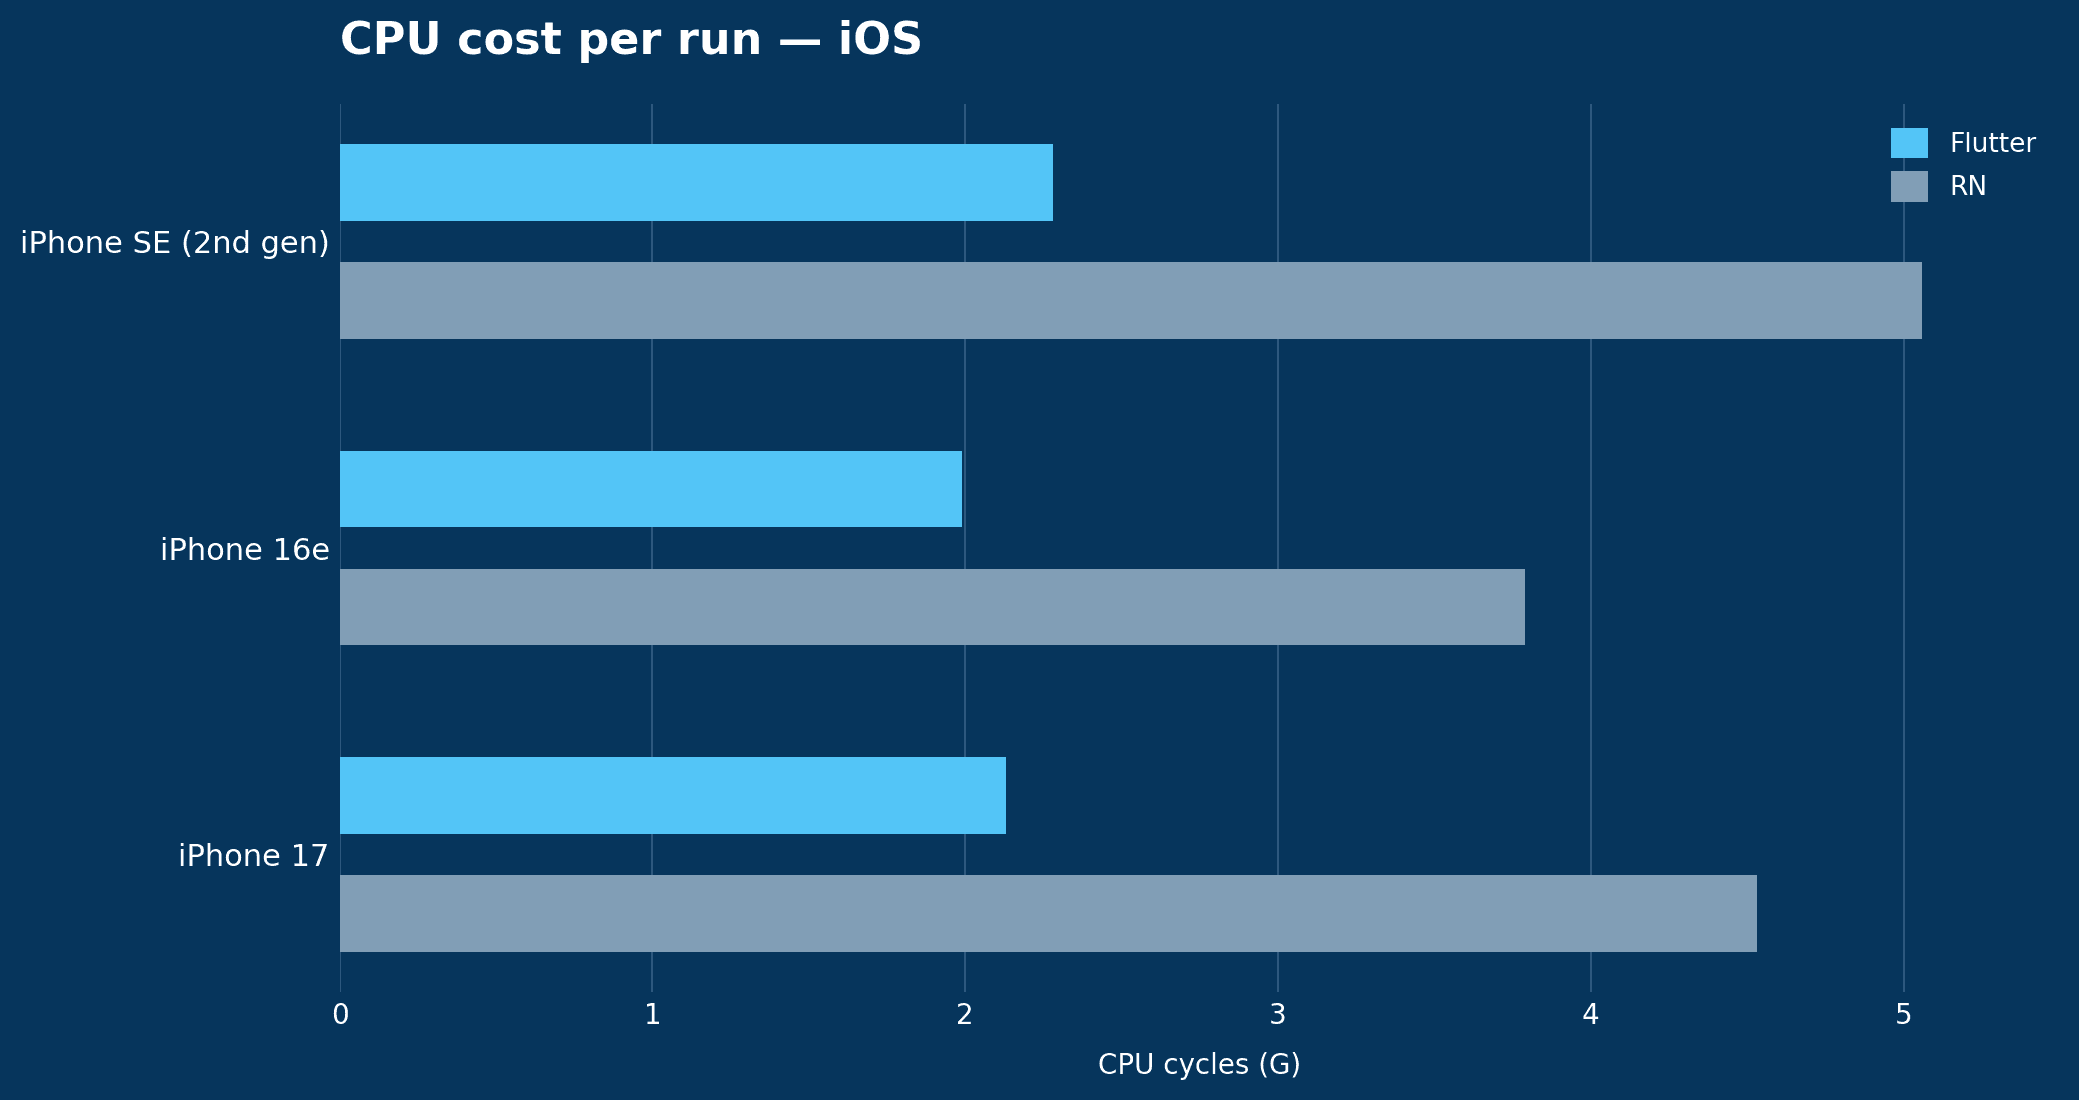
A similar pattern is present on iOS, where React Native performs nearly twice as many CPU operations. Interestingly, compared to the Kotlin vs. React Native benchmarks, there's a clear winner here in Flutter — whereas Kotlin and React Native performed very similarly on CPU usage.
The Verdict: is Flutter faster than React Native?
Let's line up the rounds.
| Metric | Android | iOS |
| App size | Flutter. No JS bundle shipped. R8 prunes everything down to 8 MB vs. 15.8 MB. | Tie. Flutter is smaller by 2.1 MB, but the difference – particularly for download size – is negligible in practice. |
| Startup time | Flutter. Reaches the first frame roughly 2x faster across all devices. | Tie. On modern Apple hardware, the difference falls within measurement noise. |
| RAM usage | Tie. The difference between technologies falls within measurement noise. | React Native. Delegates rendering to native UIKit rather than relying on a custom Impeller engine. Uses 2-3x less memory than Flutter. |
| CPU usage | Flutter. Although measurements are likely noisy, Flutter always performed far fewer operations. | Flutter. Although measurements are likely noisy, Flutter performed fewer operations. |
On Android, Flutter performs better on most metrics. This is likely a result of the custom rendering engine, as well as React Native requiring a JavaScript runtime to load – though even so, RAM usage came out roughly the same, which may also be attributable to Flutter's custom rendering engine.
On iOS, the results are more even: app size and startup time are effectively tied, RAM usage favors React Native, and CPU usage favors Flutter. iOS's RAM advantage for React Native is likely due to its reliance on native UIKit.
When we consider the results of the Kotlin comparison, it does seem that Android performance might be React Native's Achilles' heel, as both Kotlin and Flutter outperformed it there. On iOS, RAM management is a clear strength, with React Native winning in both comparisons.
However, we note that while the test scenarios mimic real-life use, they are still fairly isolated. This means they fail to capture what happens behind the scenes as a user continues to interact with the app over time – for example, what happens if someone spends a minute or two rather than fifteen seconds, or continues interacting with other features. In this case, the scenarios are limited by the app having few features, so the next step would be testing a more complex app to check whether it shows different patterns. While worth exploring, longer test scenarios would introduce further noise related to manual testing, so our methodology may need revisiting.
It's also worth keeping the bigger picture in mind: most of the gaps we measured here fall below what users actually notice in everyday use. Framework choice usually comes down to team skills, ecosystem maturity, and time-to-market just as much as raw performance. As with the Kotlin comparison before it, the takeaway isn't "pick the fastest one" – it's that the right choice depends on what you're optimizing for.