LiveStash Performance Tests
 Krzysztof Nalepa
 Filip Węgrzyn
1. The Problem of Reconnects in Phoenix LiveView
Phoenix LiveView is a powerful framework for building web applications in Elixir. It lets you create rich, highly responsive UIs with little to no JavaScript by relying on BEAM virtual processes and persistent WebSocket connections.
However, it isn't without its challenges. Because LiveView keeps the state on the server, a dropped connection puts that entire state at risk. The moment a connection breaks, the Erlang process managing your LiveView dies - instantly taking its state down with it.
This isn't just an isolated edge case; it happens every single day when users switch tabs on a mobile device, drive through a tunnel, or simply step into an elevator.
2. LiveStash: seamless and non-invasive
This is where LiveStash comes in - a library designed to persist your LiveView state across reconnects.
LiveStash takes a modular approach, allowing you to choose from a variety of adapters. Each adapter shares the exact same API but relies on a different underlying storage solution. From day one, our primary design principle was to make LiveStash as transparent and non-invasive as possible.
def mount(_params, _session, socket) do
    socket
    |> LiveStash.recover_state()
    |> case do
        {:recovered, recovered_socket} ->
          recovered_socket
        {_, socket} ->
          assign(socket, count: 0)
    end
    |> then(&{:ok, &1})
  end
Figure 1: State recovery with LiveStash
To achieve this non-invasiveness, LiveStash gives you full control over its behavior:
Explicit Management: It does not stash anything behind the scenes without your explicit instruction - you decide exactly what gets saved, though a convenient auto-stash mode is available if needed.
Automatic Cleanup: Since we treat stashes as strictly temporary data, they are cleanly purged from the storage layer once their customizable Time-To-Live (TTL) window expires. This mechanism prevents stale data from lingering in memory indefinitely.
Low Footprint: We've applied several under-the-hood performance optimizations, including aggressive term compression, to keep the overall footprint as low as possible.
To keep integration as seamless as possible, LiveStash hooks directly into the standard LiveView lifecycle using two core functions:
stash/1: You call this whenever an important state changes to securely back up your declared assigns.recover_state/1: You invoke this inside yourmount/3callback. If a user disconnects and comes back, LiveStash automatically intercepts the reconnection and restores the previous state of their assigns.
But how long should this temporary state persist? This is where the TTL comes into play. LiveStash gives developers full control by allowing them to customize the TTL for their stashed data based on their specific application needs.
If a user reconnects within the TTL window, their state is recovered instantly, ensuring a flawless user experience. If the TTL has expired, then the stashed data is purged from the storage layer, and the LiveView mounts with a fresh, default state. This mechanism is crucial for performance and resource management, as it prevents stale data from lingering in memory indefinitely.
3. The need for performance testing
All LiveStash adapters share a common goal: securely persisting your LiveView state to a storage layer. However, they each rely on radically different underlying architectures, bringing distinct strengths and trade-offs to the table.
Here is how they break down theoretically:
3.1 ETS adapter
Saves your declared assigns directly in an in-memory Erlang Term Storage table on the application node.
The Good: Low communication overhead. It only relies on internal RPC calls to recover state if a disconnected client happens to land on a different cluster node upon reconnection.
The Trade-off: Consumes your application's actual RAM and cannot survive server redeploys or node crashes.
3.2 Browser memory adapter
Pushes compressed and encrypted assigns back to the client, storing them directly within the browser's memory session.
The Good: Completely offloads state memory from your servers, allowing for a much longer Time-To-Live (TTL), and effortlessly survives server redeploys.
The Trade-off: Slightly increases the network payload size over the WebSocket connection. Note: Although the data is securely encrypted on the server, it resides in the client's browser, so standard security considerations apply.
3.3 Redis adapter
Keeps your session data entirely externalized by storing it in a separate, dedicated Redis instance.
The Good: Safely survives application server redeploys, node scaling, and crashes without putting any memory pressure on your BEAM runtime.
The Trade-off: Introduces network and communication overhead due to serialization and the RESP protocol.
3.4 Mnesia adapter
Survives application redeploys by leveraging Erlang's built-in, distributed Mnesia database with full cross-node replication.
The Good: Fully integrated into the BEAM ecosystem, eliminating the need for external third-party databases like Redis while ensuring high availability.
The Trade-off: Shares your core application infrastructure resources and introduces significant cross-node communication chatter, making it highly sensitive to network splits or transient failures.
While this rough breakdown gives a solid theoretical overview of what should happen, production environments rarely care about theory. We wanted to see exactly how these architectural choices behave under real, suffocating stress.
So, we took them straight to the battlefield.
4. Methodology: the testing environment
We provisioned an environment consisting of 5 Virtual Machines within a single private network to ensure reliable and isolated metrics:
2 VMs running a production-configured Elixir server instance.
1 VM dedicated entirely to generating load using k6, while also hosting an Nginx reverse proxy
1 VM running a standalone Redis instance.
1 VM hosting our observability stack (Prometheus and Grafana) to collect and visualize system performance in real-time.
| VM | Load (k6) | Elixir (2 apps) | Redis | Observability |
| CPU | Intel/AMD x86 | Intel/AMD x86 | Intel/AMD x86 | Intel/AMD x86 |
| Cores | 8 | 4 | 4 | 2 |
| RAM | 16GB | 8GB | 8GB | 4GB |
| Storage | 160GB | 80GB | 80GB | 40GB |
Table 1: Hardware specifications for test environment
The Test Scenario
We designed our stress scenarios specifically to evaluate how the system handles an increasing volume of concurrent traffic paired with varying Time-To-Live (TTL) expiration setups. To capture long-tail resource leaks or garbage collection bottlenecks, the total duration of each test run was set to exactly three times the configured TTL window.
During the test, each simulated user performed the following flow in a continuous loop: Connect -> Stash -> Disconnect -> Reconnect -> Stash -> Disconnect
Depending on the timing of their cycle, some users successfully recovered their previous state, while others intentionally exceeded the stash TTL window to trigger the automated server-side cleanup routines.
The users stashed a long but shallow map of regular entries - approximately 5 KB in size, which compressed down to around 0.8 KB for both the Browser Memory and Redis adapters.
Furthermore, we intentionally configured the Nginx load balancer in Round Robin mode. This setup is a critical piece of the methodology: it forced user reconnects to land on a different Elixir node than the one they disconnected from, actively triggering cross-node RPC state recovery mechanics for the local ETS adapter.
| User count | TTL | Test length | Ramp up/down |
| 1 000 | 1 min | 3 min | 45 s |
| 5 000 | 1 min | 3 min | 45 s |
| 10 000 | 1 min | 3 min | 45 s |
| 17 000 | 1 min | 3 min | 45 s |
| 25 000 | 1 min | 3 min | 45 s |
| 25 000 | 5 min | 15 min | 3 min 45 s |
| 25 000 | 15 min | 45 min | 11 min 25s |
Table 2: Test runs breakdown
5. Presenting the data
After running the scenarios, we gathered extensive metrics. Here is how the system behaved under load.
We selected the run with TTL = 5 min and 25,000 virtual users as the most representative. The charts below present the average values collected from both Elixir VMs. The baseline represents a clean LiveView application running without LiveStash.
5.1 BEAM process count
Before looking at memory or CPU consumption, we must verify that our test scenario executed identically across all configurations. The chart below tracks the total number of active concurrent Erlang processes inside the BEAM virtual machine.
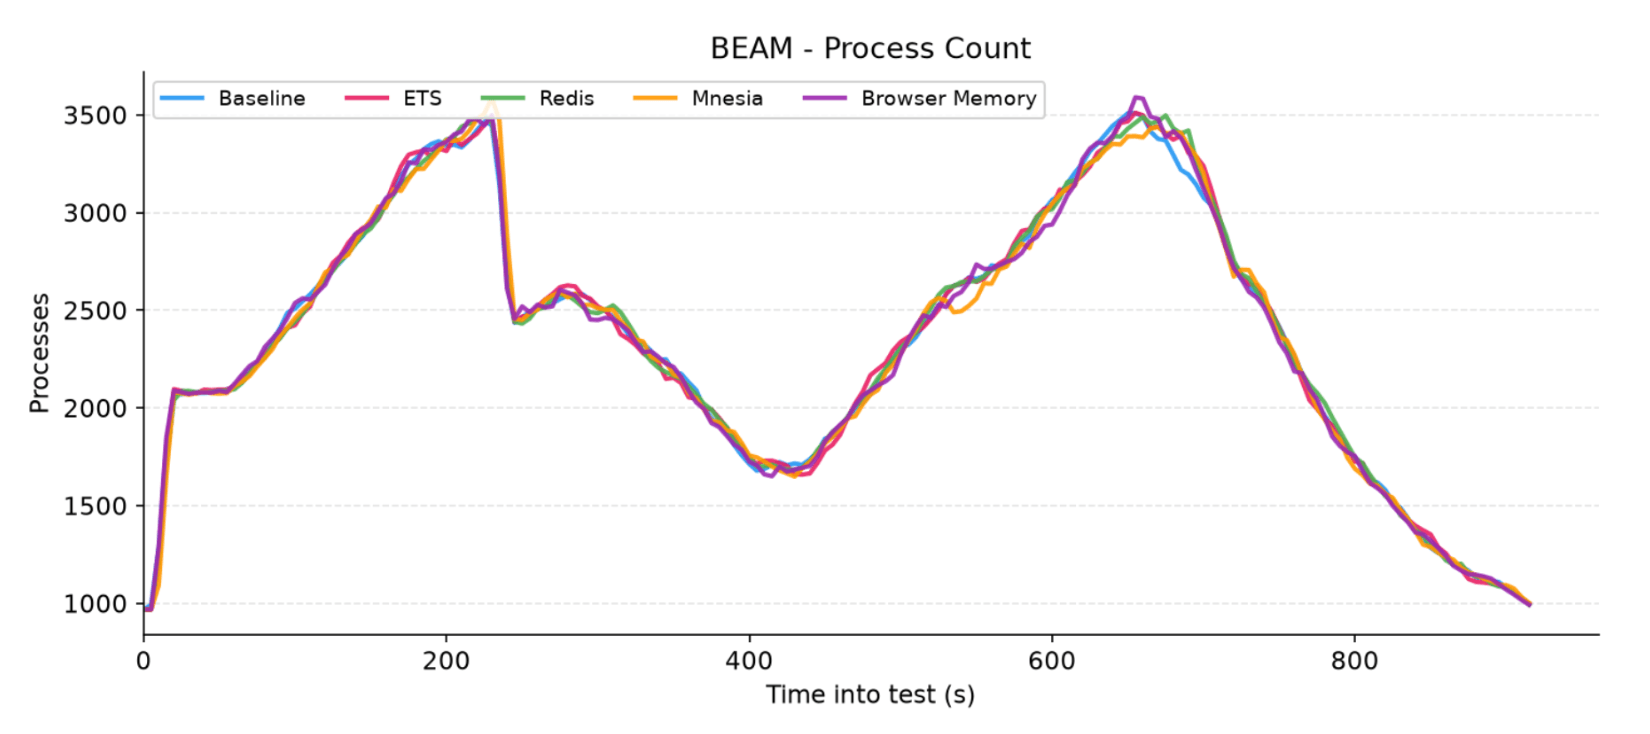
Figure 2: Total number of active concurrent Erlang processes inside the BEAM virtual machine
Looking at the graph, we can see that all five lines overlap perfectly. This demonstrates that regardless of the adapter chosen, LiveStash introduces zero process overhead and operates natively within the standard LiveView lifecycle without causing process leaks.
We can also clearly observe two distinct peaks separated by a central valley. This rhythm is a direct reflection of our test scenario's specification:
The Peaks: The first hill marks the end of the ramp-up phase where users execute their initial
Connect -> Stashsequence. The second hill represents the mass reconnection wave where users flood back to complete the loop.The Valley: This gap represents the exact period where the synchronized wave of users disconnects. Because a broken connection immediately terminates the underlying LiveView process, this valley marks the time when the majority of users are disconnected.
5.2 Memory usage
Next, we look at how the BEAM virtual machine manages memory under stress across both BEAM Binary Memory and BEAM ETS Memory.
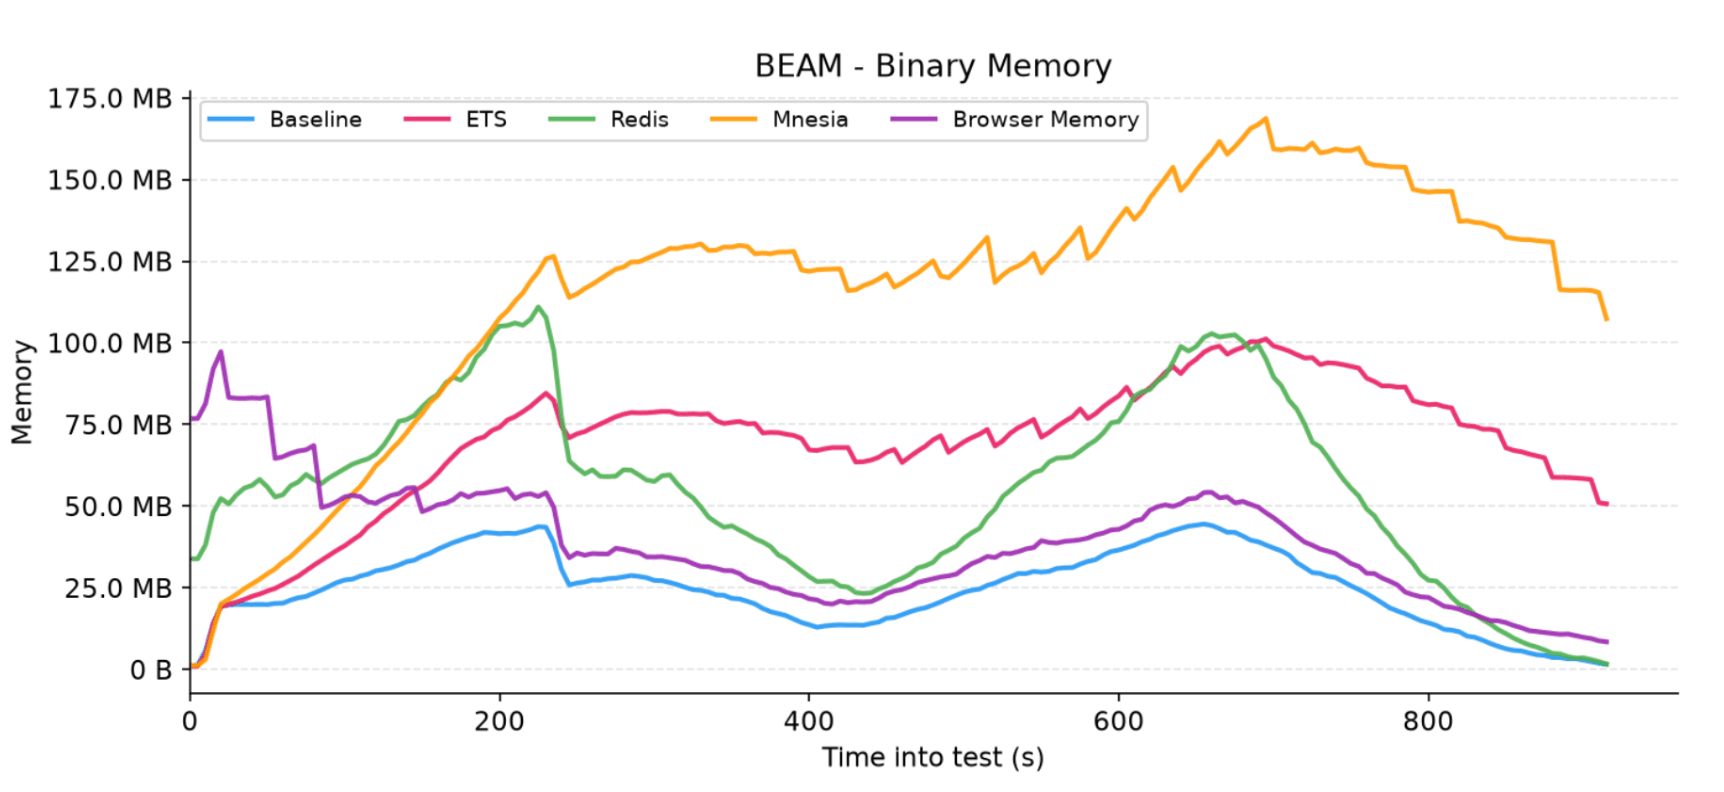
Figure 3: Total BEAM binary memory allocation in megabytes for each adapter
You'll notice the Redis and Browser Memory charts don't start at 0 MB. This is simply because the Erlang Garbage Collector (GC) hadn't finished sweeping the heavy binary blocks left behind by the previously executed ETS and Mnesia runs during the 1-minute test cooldown. In future test suites, we plan to isolate runs further by explicitly forcing global GC cycles or restarting the application nodes to avoid lifecycle contamination.
Outside of this offset, binary memory escalates predictably. The Browser Memory adapter perfectly mirrors the baseline by completely offloading compressed, encrypted state to the client. Redis adds minimal overhead from driver I/O, while the default ETS adapter uses more RAM to keep raw data resident on the server. Mnesia peaks the highest due to intense data encoding required for continuous cross-node replication.
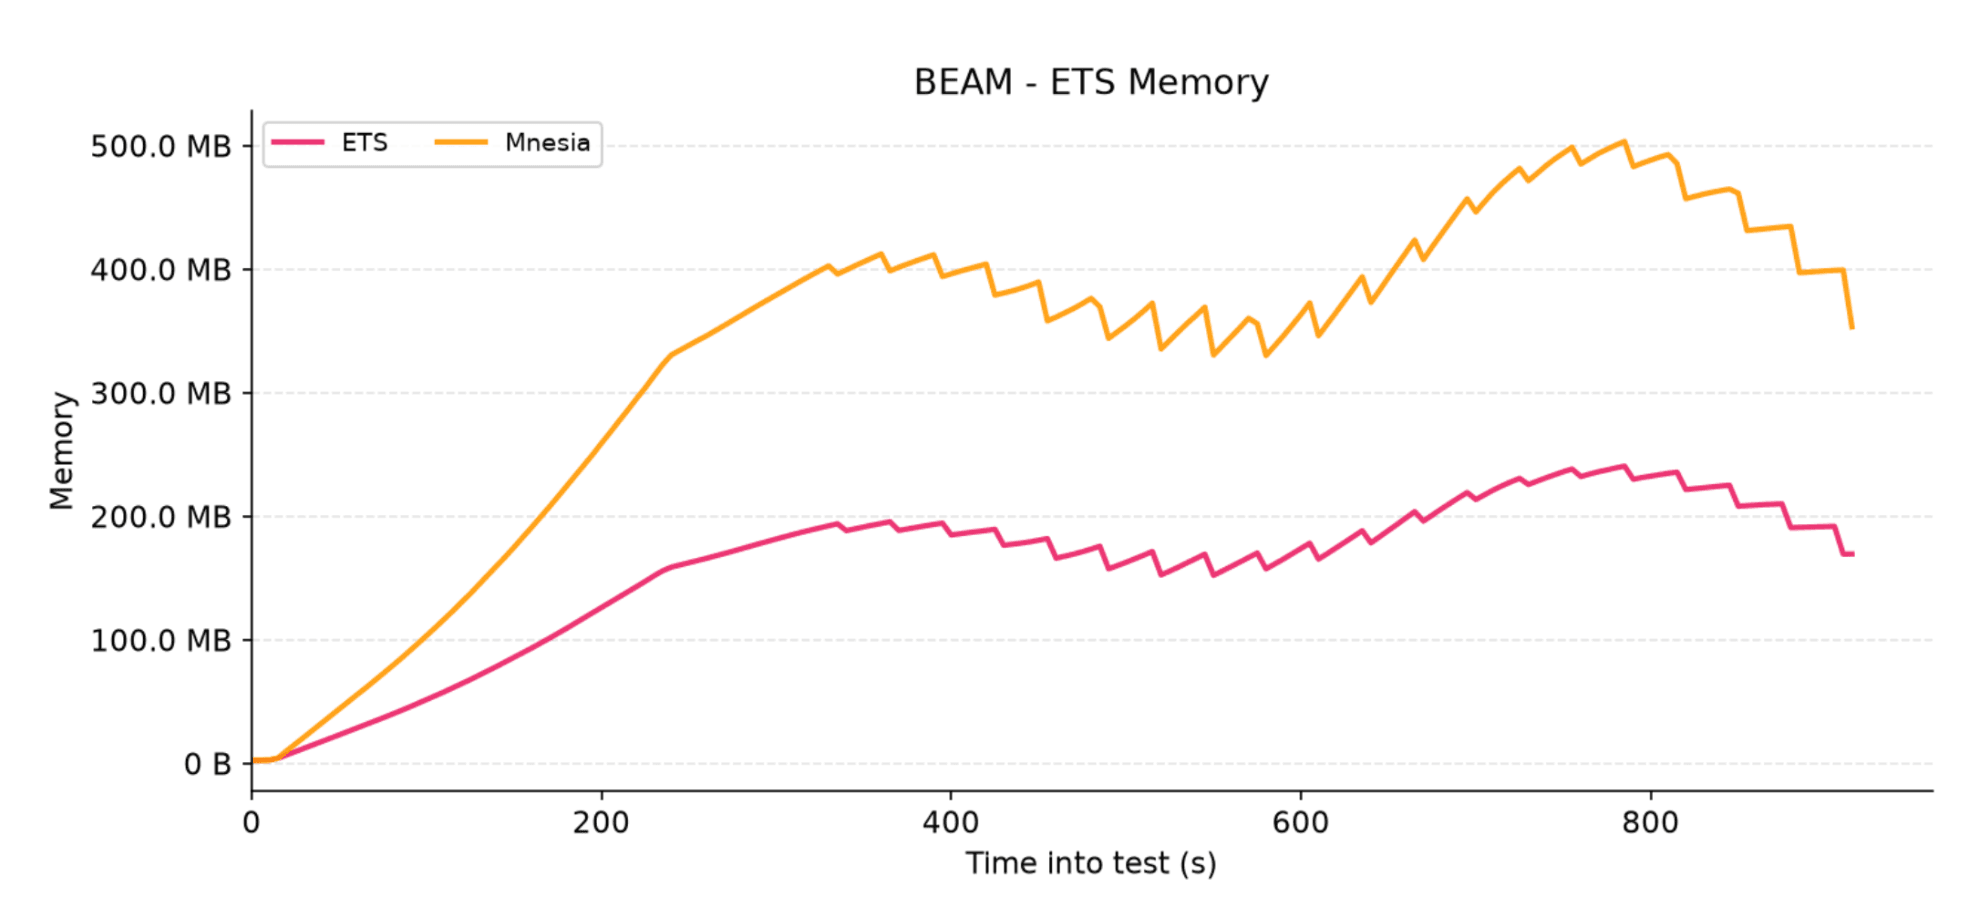
Figure 4: Total memory consumption of Erlang Term Storage (ETS) tables for each adapter
The jagged "teeth" pattern across the charts represents LiveStash’s automated background cleaner periodically sweeping the storage layer to purge stale records past their 5-minute TTL.
Notably, Mnesia consumes significantly more ETS memory than the default ETS adapter. This comes down to their replication strategies: Mnesia is eager, immediately duplicating data to all nodes to survive redeploys, whereas the default ETS adapter is lazy, keeping state strictly on a single node and fetching it via cross-node RPC only when a client reconnects elsewhere.
5.3 Network throughput
Next, we look at the network performance across both public-facing client connections and backend database channels.
5.3.1 Public-facing traffic
On both public-facing HTTP/WebSocket charts, we can immediately observe the familiar two-peak rhythm. As expected, this pattern perfectly matches our process count graph, corresponding directly to the volume and synchronization of our virtual users.
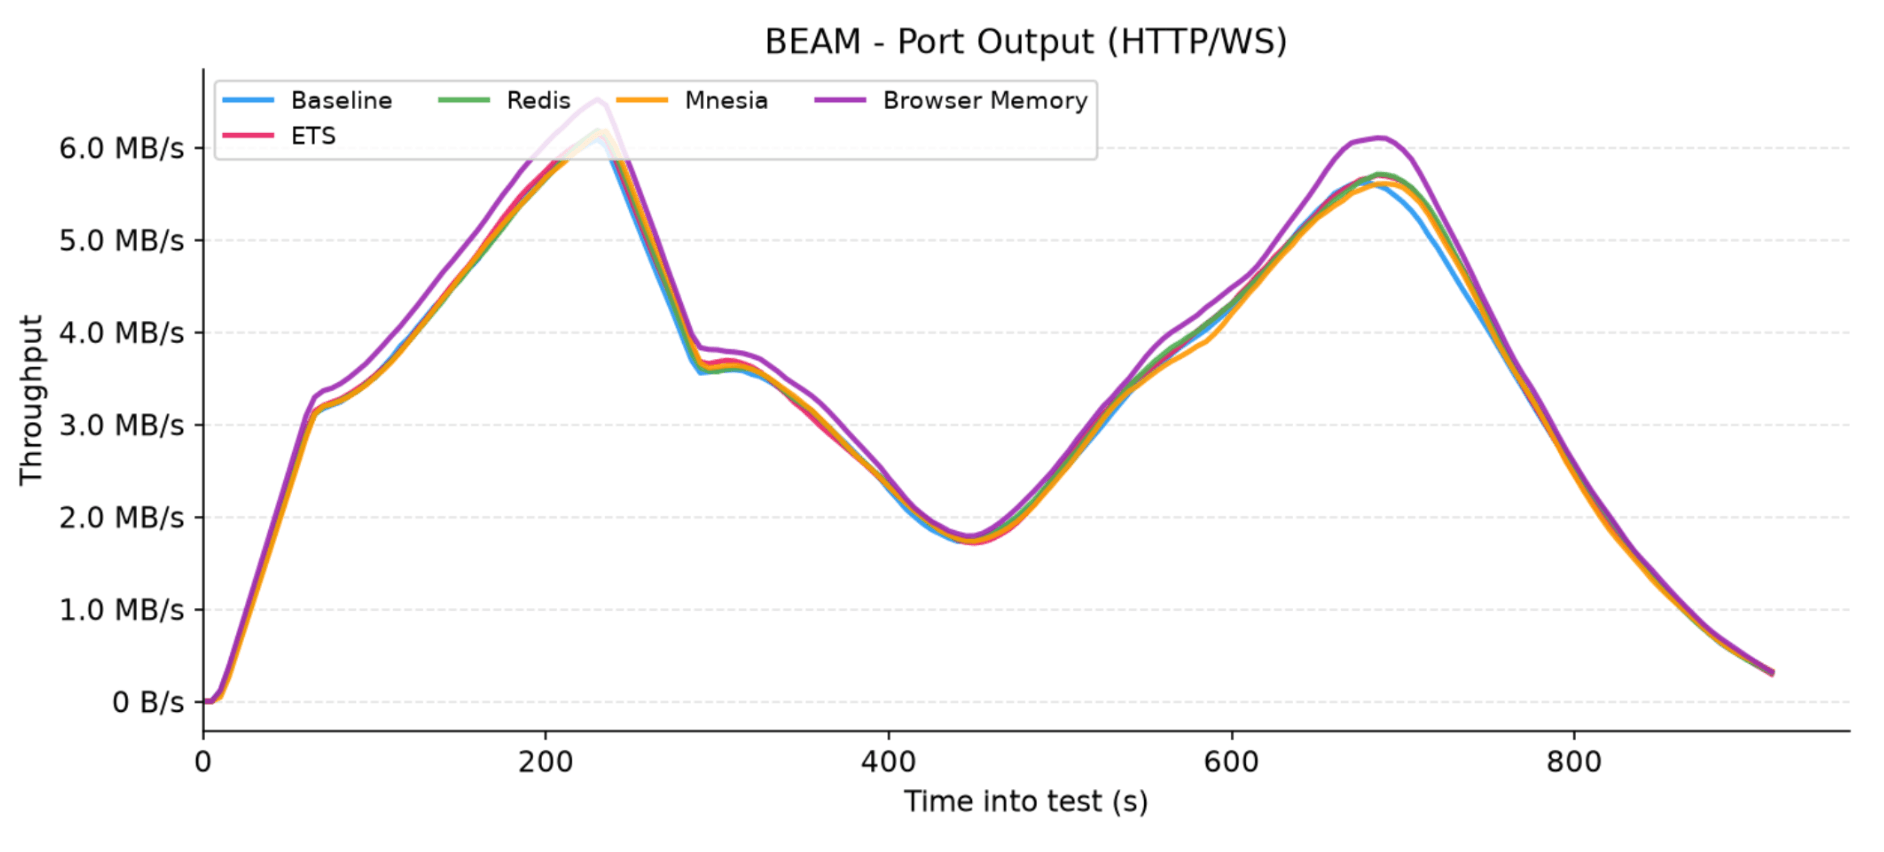
Figure 5: Network output traffic sent from the application nodes over HTTP and WebSocket connections for each adapter
Looking at the outgoing traffic (output), the throughput is remarkably similar for every adapter. The Browser Memory adapter sits slightly higher because it transmits compressed assigns directly over the wire.
However, because these assigns are so heavily compressed, the gap is minimal - Phoenix LiveView itself inherently transmits quite a lot of data when pushing native HTML diffs, which naturally masks the library's footprint. The fact that there is no distinct spike in HTTP/WS output communication highlights just how insignificant the Browser Memory overhead truly is compared to LiveView itself.
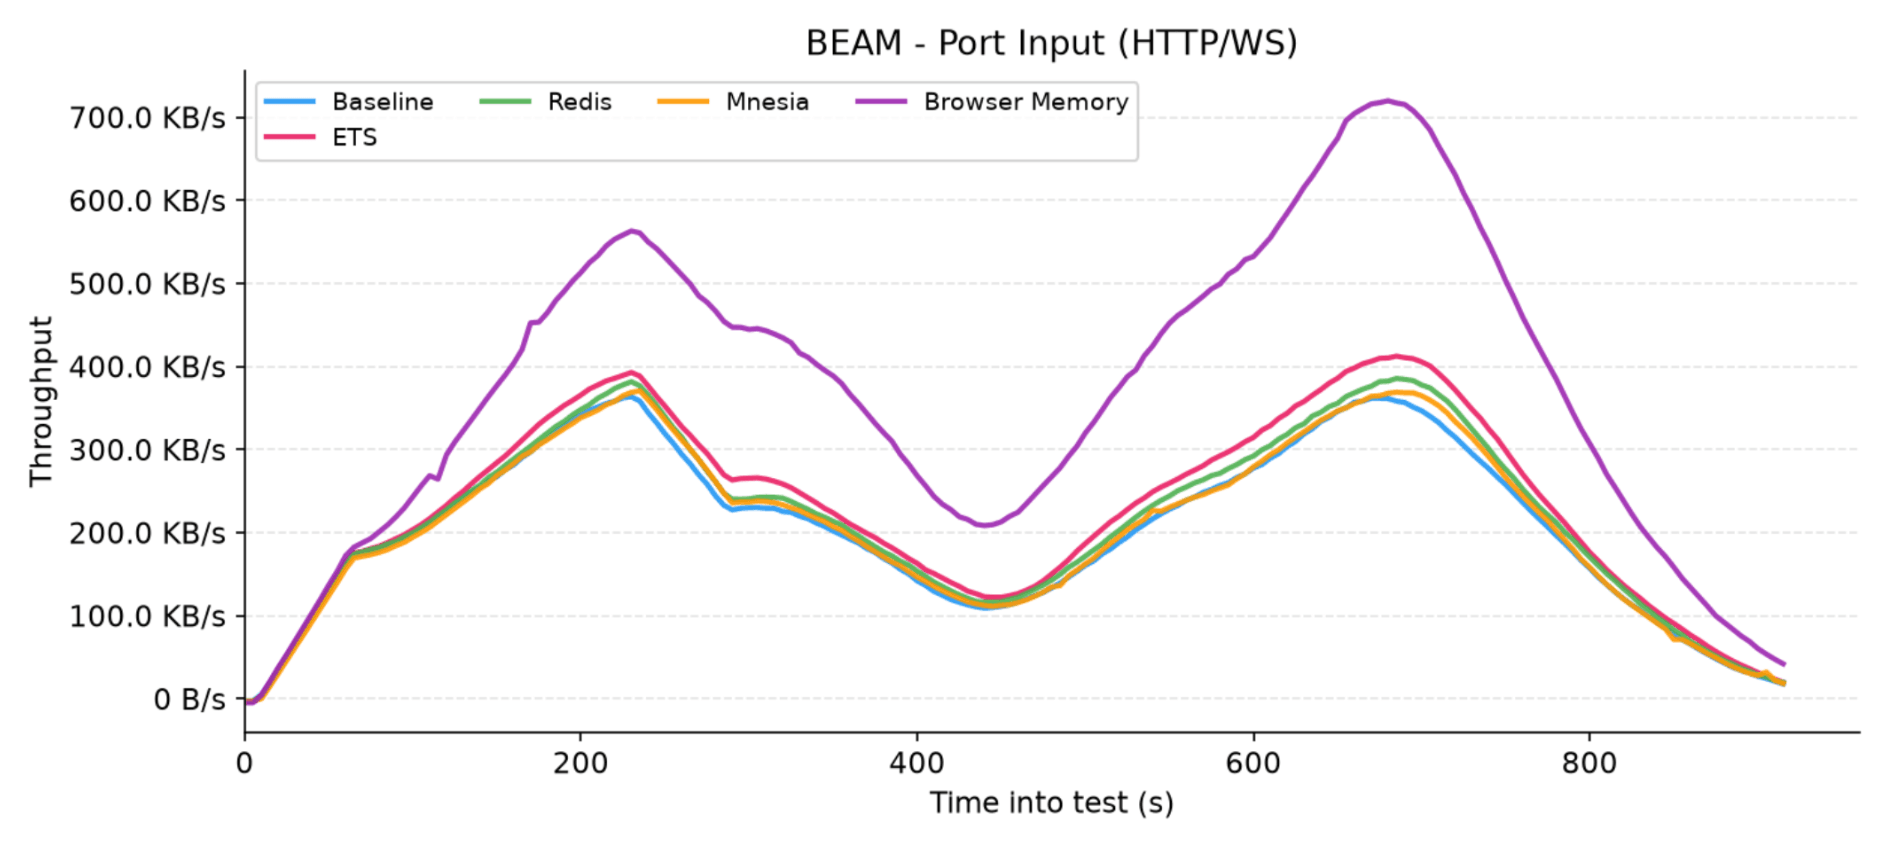
Figure 6: Network input traffic received by the application nodes over HTTP and WebSocket connections for each adapter
The real difference for the Browser Memory adapter shows up on the incoming traffic (input) chart. Here, the dominating overhead of native LiveView data transfer is absent, allowing LiveStash's operational cost to become much more transparent. We observed higher HTTP/WS input compared to the baseline. This is primarily because the adapter instantly pushes the compressed payload to the frontend on each reconnect.
5.3.2 Internode communication
While the public client traffic looks nearly identical across the configurations, the internal cluster network input chart reveals a massive divergence for the Mnesia adapter, showcasing a highly synchronized, heavy jagged pattern.
These network "teeth" appear for the exact same reason as they did in our memory charts, but here the operational effect is distributed across the entire cluster. When the automated background cleaner process purges stale records from local tables on a single node, Mnesia immediately broadcasts those transactional deletions across the private network to keep all nodes in sync, creating rapid, repeating traffic spikes.
Given this heavy, continuous replication overhead, it is no surprise that Mnesia significantly outmatches the lazy ETS adapter in terms of internal network throughput.
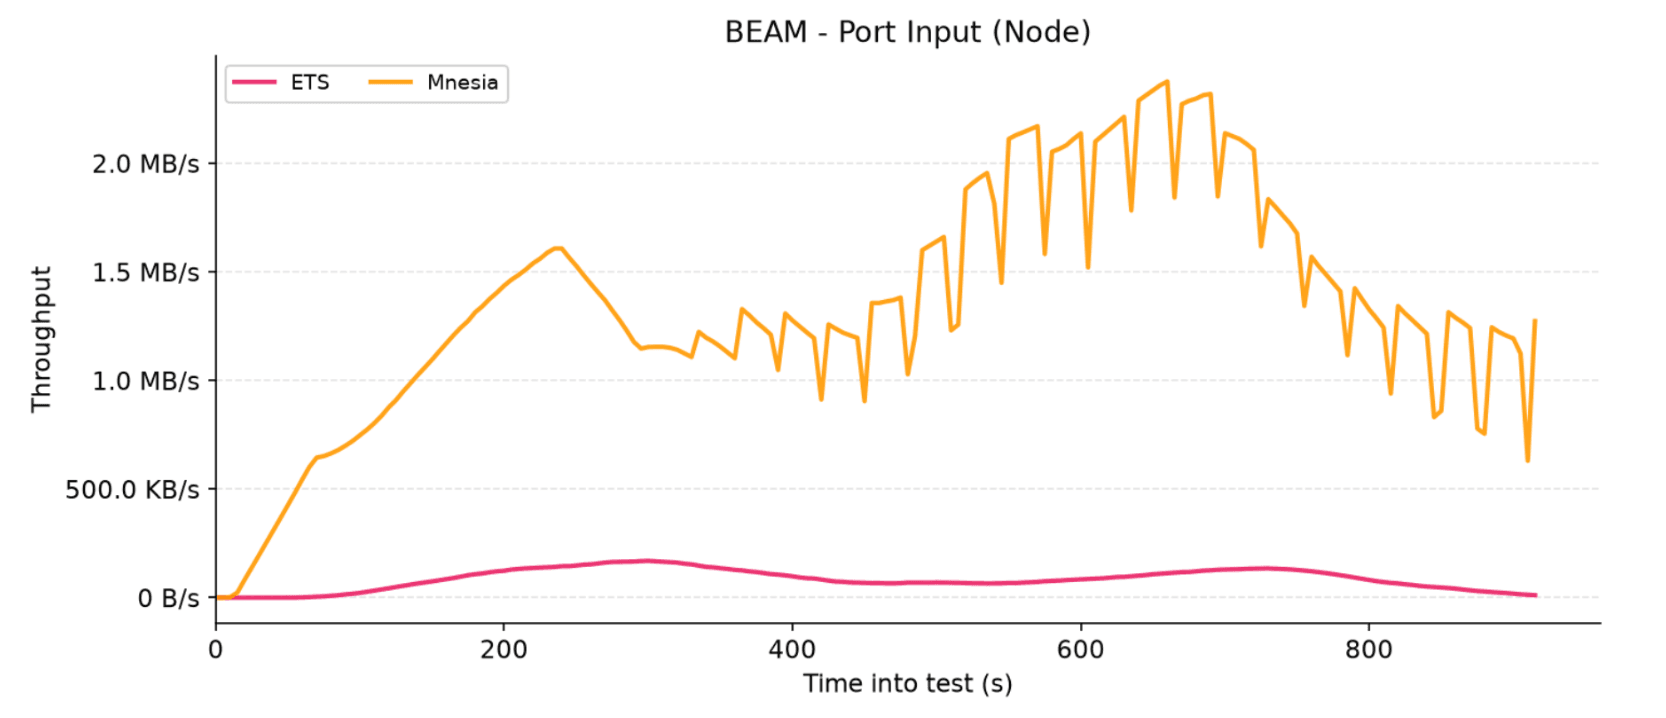
Figure 7: Internal cluster network input traffic per node for the ETS and Mnesia adapters.
5.3.3 Redis communication
In contrast to other adapters, the Redis adapter completely isolates its network traffic within its own dedicated backend port. Both the incoming and outgoing Redis throughput charts mirror the familiar two-peak rhythm, directly tracking the flow and synchronization of the virtual users throughout the test.
This setup proves to be lightweight, with input traffic peaking at a modest 80 KB/s and output traffic topping out around 310 KB/s. By offloading the entire state to an external database instance, the Redis adapter completely immunizes the core application nodes from cluster replication chatter, offering a highly predictable and efficient network profile.
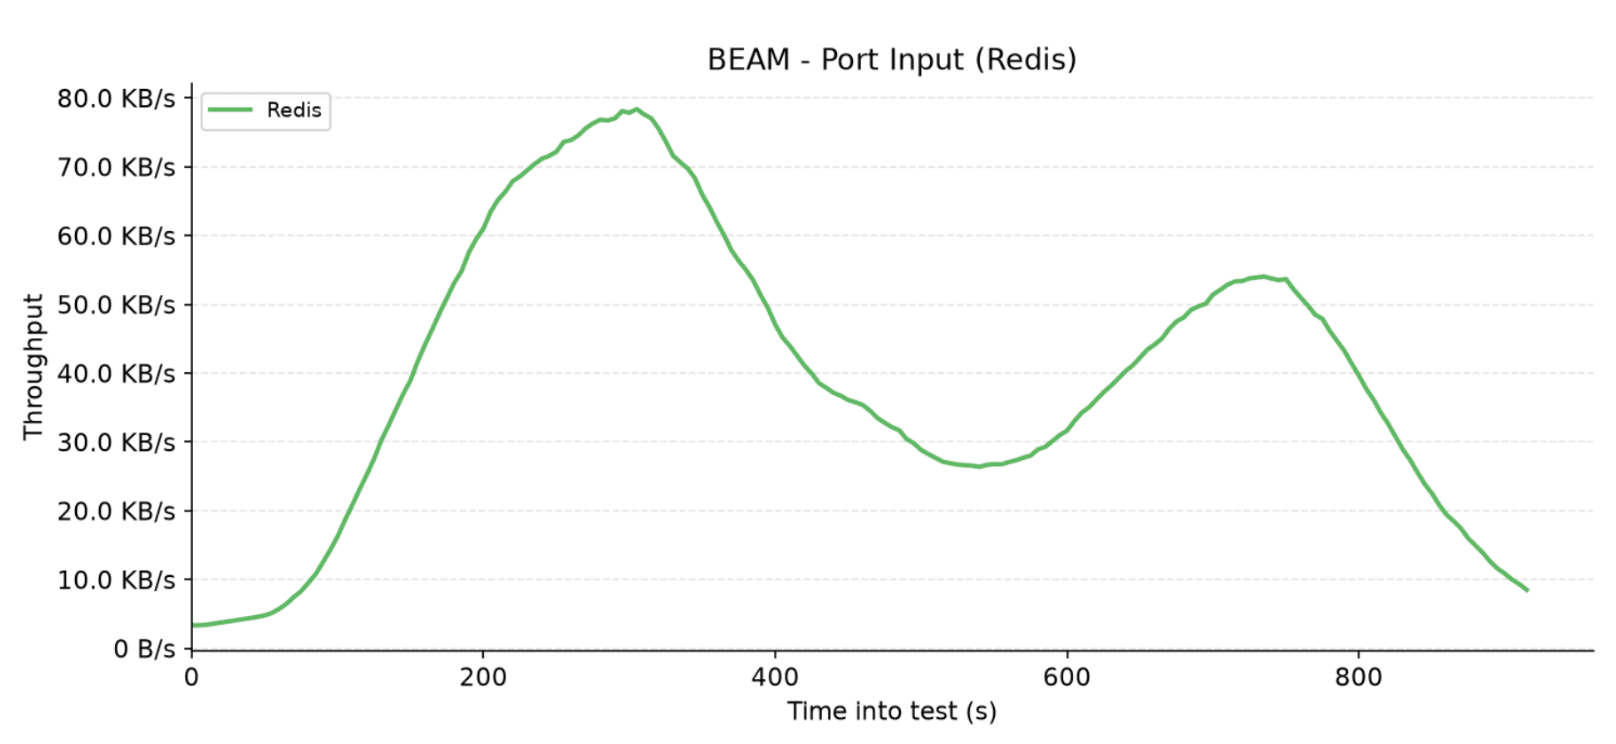
Figure 8: Network input traffic received from the Redis instance by the application node.
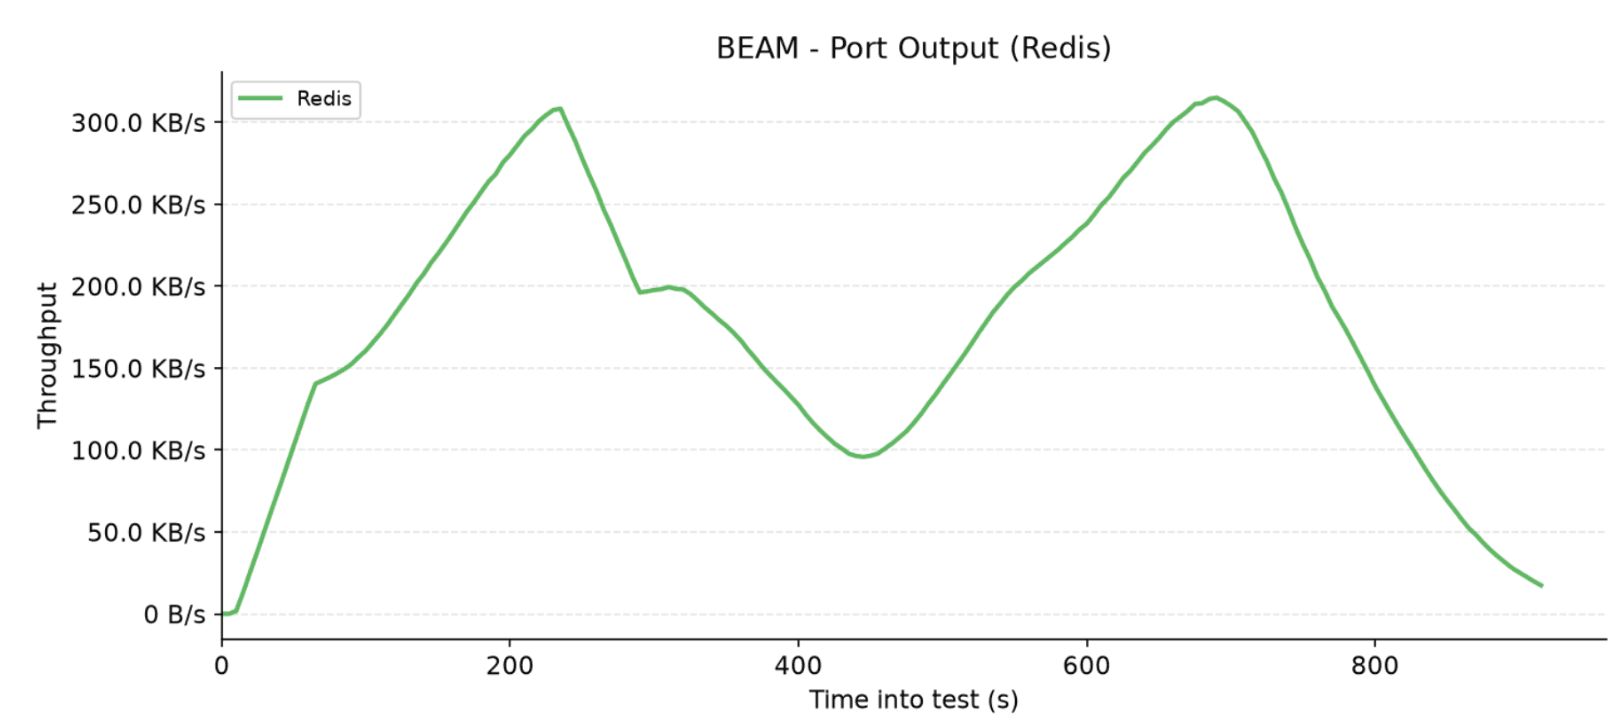
Figure 9: Network output traffic sent to the Redis instance from the application node.
5.4 CPU utilization
The CPU graph preserves the expected two-peak rhythm, mapping directly to virtual user concurrency. Looking at the results, a clear hierarchy in computational overhead emerges across the different adapters.
Mnesia demands the highest processing power, peaking at around 46% due to the heavy overhead of distributed transaction coordination, lock management, and continuous data encoding for cross-node replication. Moving down, the Redis adapter draws roughly 5–7% more CPU than the baseline, a tax driven by backend driver I/O, socket management, and constant payload serialization.
Finally, the local ETS adapter and the stateless Browser Memory configurations tightly overlap with the baseline at the bottom of the chart, proving that their respective lazy replication and client-side offloading approaches introduce virtually zero processing overhead over native Phoenix LiveView.
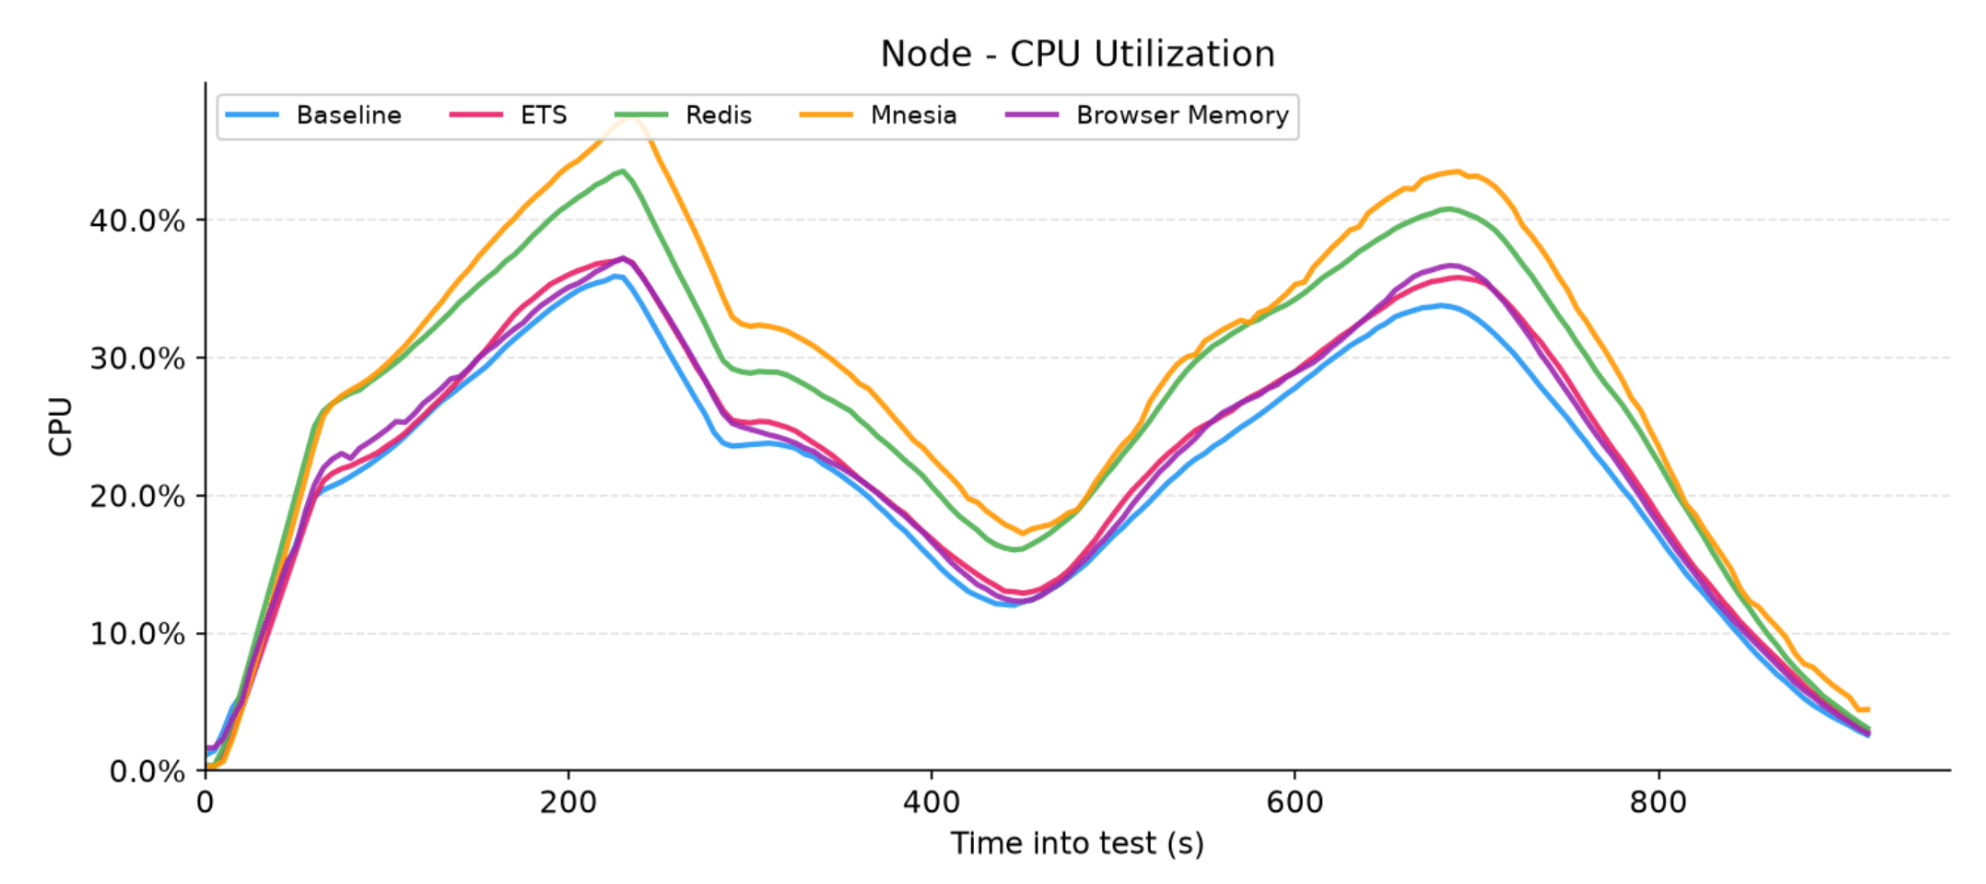
Figure 10: Total CPU utilization percentage for each adapter
5.5 Round trip times
To evaluate the end-user experience, we measured the round-trip time percentiles (p50, p95, and p99) from the k6 perspective for core LiveStash operations: first render, stash, and reconnect. Remarkably, the latency results remained rock-solid and virtually identical across all database adapters.
This extreme consistency proves that the internal storage mechanics of LiveStash introduce completely negligible overhead to the request-response lifecycle.
| Action | p50 | p95 | p99 |
| First render | 3-4 ms | 4-5 ms | 5-7 ms |
| Stash | 3-4 ms | 4-5 ms | 5-8 ms |
| Reconnect | 3-4 ms | 4-5 ms | 5-7 ms |
Table 3: The results of round trip times for each adapter
6. Final verdict: analyzing the trade-offs
Each adapter brings its own distinct architectural flavor to the table, and choosing the right one comes down to understanding how they balance memory, CPU, and network isolation.
The Browser Memory adapter shifts the paradigm completely by offloading state to the frontend. It exhibits slightly higher binary memory and noticeably higher HTTP/WS input because it immediately delivers the compressed payload to the client instead of keeping references on the server. Architecturally, this adapter introduces a theoretical size limit on your assigns, as the state payload is passed directly through the WebSocket connection's query parameters. However, because LiveStash utilizes such aggressive term compression under the hood, hitting this buffer ceiling under real-world usage is exceptionally difficult. Ultimately, its impact on outgoing communication remains practically invisible next to native Phoenix LiveView traffic, making it a stellar stateless option.
For an externalized state, the Redis adapter strikes an excellent balance. It introduces only a minor binary memory overhead - briefly held by the driver process during I/O - while maintaining exceptionally low communication traffic that remains completely isolated from your core application network.
If you prefer keeping data local, the ETS adapter serves as the optimal "lazy" approach. It displays a higher local memory footprint because it keeps raw state data resident in RAM, but it rewards you with almost non-existent network chatter, utilizing tiny cross-node RPC fetches only when a reconnecting user happens to land on a different cluster node.
On the other hand, the Mnesia adapter represents the "eager" high-availability configuration. It sacrifices significant binary memory and generates heavy cross-node network chatter because it actively and immediately replicates state changes across the entire cluster, ensuring absolute data survival across node redeploys.
Ultimately, the right choice depends on your specific infrastructure, scaling goals, and the trade-offs you are willing to accept. We hope this deep dive sheds some light on the inner workings of LiveStash and helps you make an informed decision for your next Phoenix project.
7. The future
As of right now, we consider LiveStash to be feature-complete, and we do not have any new features planned for the future. The library is officially entering maintenance mode.
However, this doesn’t mean it's abandoned! Issues and Pull Requests are highly welcome - we will continue to actively review them, fix bugs, and ensure the library stays stable and compatible with future updates. If you spot a bug or want to contribute a fix, please feel free to open an issue or drop a PR in the repository!
Be sure to check out our GithHub and previous blog post on the problem of reconnects in Phoenix LiveView.